Summary: The Reserve Bank of India Governor’s Statement dated October 7, 2026 records the Monetary Policy Committee’s unanimous decision to increase the policy repo rate under the liquidity adjustment facility by 25 basis points to 5.50 per cent and change the monetary policy stance to calibrated tightening. Consequently, the standing deposit facility rate stands at 5.25 per cent, while the marginal standing facility rate and Bank Rate stand at 5.75 per cent. The MPC observed that inflation and its outlook were no longer as benign as in the previous year and stated that rate cuts were off the table in the near term, with future action being either a rate hike or pause depending on evolving conditions. Real GDP growth for 2026-27 is projected at 7.1 per cent, while CPI inflation is projected at 5.2 per cent and core inflation at 4.4 per cent. The Statement also reviews liquidity, financial stability and external-sector conditions, noting robust bank credit growth, sound system-level parameters of banks and NBFCs, and adequate foreign exchange reserves. RBI additionally announced interoperability among NBFC Account Aggregators and facilitation of bank deposit information in consolidated account statements, with implementation targeted by December 31, 2026. It also announced constitution of a Technical Consultative Committee for Financial Markets. Pasted text Pasted text
Reserve Bank of India
October 07, 2026
Governor’s Statement, October 7, 2026
Good morning and Namaskar. My greetings to all and best wishes for the forthcoming festive season.
2. The sudden reescalation of the West Asia conflict in September and the consequent hardening and volatility in global crude prices soured global economic sentiments and heightened financial market volatility. Although global growth remains resilient, it is projected to decelerate in 2026 from the previous year. Driven by escalating energy costs and rising food prices, global inflation is projected to increase sharply prompting monetary policy tightening by major central banks. Lingering trade uncertainty, rising bond yields in advanced economies and an appreciating dollar are keeping global financial market sentiments nervous and fragile. Further tightening of global financial conditions, uncertainty about fair valuation of AI stocks, and an elusive resolution of the West Asia conflict pose significant downside risks to the global economic outlook.
Decisions of the Monetary Policy Committee
3. In this global backdrop, the Monetary Policy Committee (MPC) met on 5th, 6th and 7th of this month to deliberate and decide on the policy repo rate. After a detailed assessment of the evolving macroeconomic and financial developments and the outlook, the MPC voted unanimously to increase the policy repo rate under the liquidity adjustment facility (LAF) by 25 bps to 5.50 per cent. Consequently, the standing deposit facility (SDF) rate stands adjusted at 5.25 per cent and the marginal standing facility (MSF) rate and the Bank Rate at 5.75 per cent. The MPC also decided to change the stance to calibrated tightening.
4. I shall now briefly set out the rationale for these decisions.
5. The MPC noted that the global context on account of geopolitical developments remains challenging. Nonetheless, the Indian economy has been strong, and the economic momentum remains broad-based. Moreover, the economy is expected to remain resilient.
6. It further observed that in light of available data, it is clear that inflation and its outlook are not benign as they were last year, with headline CPI inflation expected to average almost 5.8 per cent in the next three quarters and core inflation projected at 4.4 per cent this financial year. In this milieu, recalibrating the policy rate is imperative.
7. As regards supply side inflation, the MPC noted that monetary policy primarily acts by curtailing second round effects (inflation expectations and firm level pricing behaviour, etc.), which take time to manifest and are difficult to extract from available data. Apart from data related to inflation expectations and firm level pricing behaviour, indicators of generalisation of inflation like core inflation and diffusion indices are used for this purpose. It may, however, be kept in mind that it is difficult to distinguish between the second-round effects and the indirect impact of supply side pressures (in production cost through energy and other inputs) as both are present in these indicators. While there is some evidence of elevated inflation expectations and generalisation of inflation, there are limited signs of supply side pressures getting embedded in pricing behaviour.
8. Similarly, while there is limited evidence of demand side pressures, risks in view of strong growth in monetary and credit aggregates exist.
9. Considering all these factors, the MPC unanimously voted to increase the policy repo rate by 25 basis points to 5.50 per cent. The MPC also decided to change the stance to calibrated tightening. It underscored that given the current conditions, rate cuts are off the table in the near term and policy action ahead can only be a rate hike or a pause, depending on the evolving conditions and the outlook. The duration and extent of the rate hike cycle would be contingent on the actual growth-inflation developments and outlook, especially that of underlying inflation, the extent of broadening of price pressures and second round effects of the supply shock, as also the impact of demand impulses.
Assessment of Growth and Inflation
Growth
10. Domestic economic activity exhibited resilience amidst global headwinds as evident from real GDP growth of 7.8 per cent in Q1:2026-27. Growth was driven by resilient private consumption and strong investment activity while contribution of net exports also remained positive.
11. High frequency indicators available so far suggest that economic activity is holding momentum in Q2, albeit with some moderation compared to the preceding quarter. Despite deficient and uneven southwest monsoon,1 kharif sowing, although somewhat above its normal level,2 has been marginally lower than last year. Manufacturing activity, despite cost pressures, is holding well, as indicated by IIP and PMI.3 Services sector activity remained steady and broad-based, owing to buoyant domestic and external demand.4 Both manufacturing PMI and services PMI remained in expansionary zone in Q2:2026-27, although the pace of expansion slowed from Q1.5 Private consumption remained broadly resilient in Q2, with continued support from discretionary spending.6 Fixed investment remained strong as evident from several related indicators.7 Some weakness is, however, observed in segments such as non-durable goods and domestic air passenger traffic.8 With focus on expanding market access and diversification, merchandise exports registered higher double-digit growth during July-August 2026. Services exports also recorded an accelerated growth during July-August 2026.9
12. Looking ahead, global economic uncertainty and supply chain disruptions are expected to have some bearing on domestic economic activity. Furthermore, weak southwest monsoon along with strong El Niño conditions may impact the upcoming rabi season and rural demand. The likely resilient non-farm activity, however, will continue to support rural consumption. Sustained momentum in services, and broadly stable employment conditions are expected to sustain urban demand. The Government’s continued thrust on infrastructure spending, rebound in private capex and strong credit flows are expected to bolster investment activity. While services exports are expected to remain buoyant, the recently operationalised bilateral trade agreements should support merchandise exports. Global headwinds from protracted geopolitical tensions, elevated international commodity prices, additional frictions in global trade and tightening of global financial conditions may weigh on growth outlook. Taking all these factors into consideration, real GDP growth for 2026-27 is projected at 7.1 per cent; Q2 at 7.2 per cent; Q3 at 6.9 per cent; and Q4 at 6.8 per cent. The upward revision in growth forecast by 40 bps further underscores the strength of economic activity despite significant headwinds. Real GDP growth for Q1:2027-28 is projected at 7.1 per cent. The risks are evenly balanced.
Inflation
13. CPI inflation increased to 4.8 per cent in August 2026 from 4.5 per cent in July. This was largely driven by higher inflation in food10 and fuel11 components. Food price increases have become more broad-based along with notable spikes in certain items such as sugar12 and onion13. Fuel inflation inched up in August, mostly due to unfavourable base effects. Core14 inflation also increased to 4.2 per cent in August after remaining unchanged at 3.9 per cent for three consecutive months. Core inflation, excluding precious metals, increased to 2.9 per cent in August. Broadening of prices pressures was visible in the diffusion indices as the weighted share of items recording inflation above 4 per cent increased to about 37 per cent in August 2026.15
14. The near-term outlook on inflation points towards continued pressures from supply side, on account of the deficient Southwest monsoon16, El Nino conditions and high volatility in international oil prices17. Price pressures are increasingly becoming visible across a range of commodities within the food component, apart from oil.18 In addition, early signs of inflation becoming generalised are also evident from the increase in core inflation and higher inflation across a larger segment of the CPI basket.
15. Considering all factors, CPI inflation for 2026-27 is projected to be 5.2 per cent with Q2 at 4.9 per cent; Q3 at 6.0 per cent; and Q4 at 5.7 per cent. Inflation for Q1:2027-28 is projected at 5.6 per cent with risks being evenly balanced. Core inflation is projected at 4.4 per cent for 2026-27.
Liquidity and Financial Market Conditions
16. During August and September, system liquidity increased substantially on account of the recent measures undertaken to attract capital inflows. As measured by the net position under the LAF, system liquidity stood at an average daily surplus of ₹5.9 lakh crore since the last MPC meeting in August 2026.19 The measures taken to absorb liquidity20 combined with quarterly advance tax outflows moderated the surplus liquidity in September.
17. In view of the surplus liquidity conditions, the weighted average call rate largely traded in the lower half of the policy corridor in the recent period.21 Short-term money market rates, especially rates of commercial papers and certificates of deposit moderated significantly in August-September.22 G-sec yields hardened from mid-August to September amidst renewed geopolitical tensions in West Asia, rise in global bond yields and increase in crude oil prices. Transmission in the credit market reflected dissimilar movements in deposit and lending rates during July-August.23 Nevertheless, credit growth continues to remain robust24 and broad-based25 across sectors.
18. Going forward, the Reserve Bank will use an appropriate mix of liquidity management tools and strive to align the weighted average call rate (WACR) with the policy repo rate.
Financial Stability
19. The system-level financial parameters related to capital adequacy, liquidity, asset quality and profitability of Scheduled Commercial Banks (SCBs) continue to remain robust.26 Similarly, the system-level parameters of NBFCs are also sound.27
External Sector
20. Coming to the external sector, India’s current account deficit (CAD) remained modest and well below the sustainable levels in Q1:2026-27 despite enduring external shocks.28 Notwithstanding robust services trade surplus29 and net remittance receipts30, CAD widened in July 2026 due to a higher merchandise trade deficit. India’s merchandise trade deficit increased to US$ 58.7 billion during July-August 2026 from US$ 55.1 billion in July-August 2025, mainly driven by imports of electronic goods and crude oil.31 Going forward, moderation in global trade growth32, elevated energy prices and persistent trade policy uncertainties pose upside risks to India’s current account deficit in 2026-27. Expected buoyancy in services trade surplus, robust inward remittances and implementation of the India-UK trade deal along with other recent bilateral treaties with major trading partners would also provide resilience to India’s external sector.
21. On the external financing front, net foreign direct investment (FDI) registered sustained improvement with inflows at US$ 13.8 billion during April-August 2026, higher than US$ 9.6 billion a year ago, driven by higher gross inflows and a slowdown in the growth of outward FDI33. Robust gross FDI reflects the strong interest of global investors on India34. While foreign portfolio investment (FPI) recorded net outflows of US$ 10.3 billion during April-October 5, 2026, capital flow measures undertaken in the June 2026 policy have supported inflows; consequently, the balance of payments is expected to record a healthy surplus in 2026-27.35
22. India’s foreign exchange reserves36 continue to remain adequate in terms of the standard metrics of reserve adequacy with import cover of around 11 months and external debt cover of 94.4 per cent.
23. We remain committed to ensuring orderly adjustments to the exchange rate that are in sync with the underlying macroeconomic fundamentals and curbing excessive volatility.
Additional Measures
24. Before I conclude, I have two additional measures to announce.
25. First, we are allowing inter-operability among NBFC Account aggregators, enabling aggregation of financial information through all account aggregators from one account aggregator. We are also facilitating SEBI regulated depositories to include information related to deposit accounts in their consolidated account statement (CAS). The measures will be implemented by December 31, 2026.
26. Second, in response to the rapidly evolving financial market dynamics, we shall constitute a Technical Consultative Committee for Financial Markets. The Committee will serve as a forum for structured engagement with market participants and other stakeholders on policy and operational matters related to financial markets.
Concluding Remarks
27. Summing up, the West Asia conflict, tariff related uncertainties, elevated bond yields and risks of an unwieldy correction in valuation of AI stocks are keeping global economic sentiments edgy with risk-off sentiments on EMEs. While these factors are weighing on the domestic growth-inflation outlook adversely, the inherent resilience and strength of the Indian economy are helping navigate through these challenging times. We shall implement policies that further add to this resilience. Accordingly, we shall strive for price and financial stability as both are essential for sustainable growth in the long run.
28. Thank you. Namaskar and Jai Hind.
Press Release: 2026-2027/1266
(Brij Raj)
Chief General Manager
Notes:
1 As on September 30, 2026, the cumulative rainfall deficit from its normal level was 12.6 per cent.
2 As on October 2, 2026, the total actual area sown under kharif crops was 1115.3 lakh hectare, i.e., 101.0 per cent of normal area sown.
3 The IIP-Manufacturing grew by 8.6 per cent in July-August 2026 as compared with 6.9 per cent in Q1:2026-27. Within two-digit manufacturing sectors, 19 out of 23 sectors recorded positive growth in July-August 2026 as compared with 16 sectors in Q1:2026-27.
4 Port cargo grew by 8.6 per cent in July-August 2026 (6.1 per cent in Q1:2026-27). Railway freight traffic rose 7.1 per cent in July-August 2026 (1.5 per cent in Q1). Diesel consumption increased by 8.5 per cent in July-August 2026 (2.8 per cent in Q1).
5 The purchasing managers’ index (PMI) for manufacturing stood at 53.8 (average) for Q2:2026-27 (54.6 in Q1). The PMI for services is at 54.2 (average) for Q2:2026-27 (58.7 in Q1).
6 Growth in IIP consumer durables was 11.5 per cent in July-August 2026 (8.0 per cent in Q1). Two-wheeler sales (retail) increased by 26.9 per cent in Q2:2026-27 (15.3 per cent in Q1). As at end-August 2026, growth in personal loan credit by banks was 16.9 per cent (y-o-y). UPI transactions (volume) grew by 22.2 per cent in Q2:2026-27 (24.2 per cent in Q1).
7 IIP-capital goods increased by 17.9 per cent in July-August 2026 (15.2 per cent in Q1) while import of capital goods rose by 24.5 per cent in July-August 2026 (25.6 per cent in Q1). Cement output rose 12.6 per cent in July-August 2026 (8.9 per cent in Q1:2026-27). The capex of central government grew by 8.5 per cent in July-August 2026 (23.7 per cent in Q1).
8 Growth in IIP for consumer non-durables was 0.6 per cent in July-August 2026 (1.8 per cent in Q1). Growth in domestic air passenger traffic stood at (-)5.4 per cent in July-August 2026 (1.2 per cent in Q1).
9 Merchandise exports grew by 22.8 per cent in July-August 2026 (15.9 per cent in Q1:2026-27). Services exports expanded by 13.5 per cent in July-August 2026 (9.1 per cent in Q1:2026-27).
10 Inflation in CPI food and beverages division increased to 5.2 per cent and 5.7 per cent, respectively, in July and August from 5.1 per cent in June 2026. The increase in food and beverages inflation remained broad-based, with meat, eggs, sugar and spices recording double digit inflation.
11 Fuel represents the group ‘Electricity, gas and other fuels’ and class ‘Fuels and lubricants for personal transport equipment’. Fuel inflation increased to 4.6 per cent in July and 5.2 per cent in August from 4.5 per cent in June.
12 Sugar prices rose by about 34 per cent from early July to ₹64/kg by end-August, due to tight demand-supply balance and precautionary stocking by market intermediaries. Government measures, including export restrictions, stock limits, duty-free imports of 10 lakh tonnes of raw sugar, stock verification, and advancing the sugarcane crushing season, helped ease price pressures. Prices have since retreated gradually in September.
13 Onion prices increased by about 85 per cent by end-September over end-June, driven by low rabi stocks and concerns over kharif arrivals amid uneven rainfall. As a result, the increase during August-September is sharper than the usual seasonal pick-up.
14 CPI core is defined as CPI excluding food and beverages division, and fuel (both the group ‘Electricity, gas and other fuels’ and the class ‘Fuels and lubricants for personal transport equipment’).
15 Methodology document for diffusion indices is available at the following path: DBIE Home (data.rbi.org.in) > Statistics > Real Sector > Prices & Wages > Diffusion Indices based on CPI data.
16 The Southwest monsoon rainfall ended 13 per cent below the Long Period Average (LPA) as on September 30, 2026.
17 In September 2026, Brent crude oil front-month contract prices have increased by 22 per cent and 15 per cent, on average, over July and August levels, respectively.
18 According to Petroleum Planning and Analysis Cell (PPAC), the Indian basket of Crude Oil price increased to average US$ 90.2 per barrel in August and US $116.1 per barrel in September from US $82.0 in July.
19 The average daily net absorption under the LAF increased from ₹1.2 lakh crore in July 2026 to ₹5.8 lakh crore in August and further to ₹7.8 lakh crore in September.
20 The Reserve Bank conducted 55 variable rate reverse repo (VRRR) auctions, including 2 term VRRR auctions and OMO sales amounting to ₹1.0 lakh crore since August 2026 policy.
21 The WACR on average traded 14 basis points below the policy repo rate since August policy.
22 The rates on 3-month treasury bill, 3-month certificates of deposit and 3-month commercial paper averaged 5.29 per cent, 6.33 per cent and 6.91 per cent respectively since August policy compared to 5.28 per cent, 6.73 per cent and 7.08 per cent, respectively during June and August policy.
23 During July-August 2026, the weighted average lending rate (WALR) of SCBs on fresh rupee loans hardened by 8 bps (interest rate effect: 3 bps), while it remained unchanged on outstanding loans. In contrast, the weighted average domestic term deposit rate (WADTDR) moderated by 28 bps and 2 bps for fresh deposits and outstanding deposits, respectively, due to a decline in bulk deposit rates on account of a surge in liquidity from mobilisation of FCNR(B) deposits. The moderation in transmission to fresh lending rates in recent months reflects robust credit demand as well as a change in composition of banks’ lending.
24 On a year-on-year basis, bank credit registered a growth of 18.1 per cent as on September 15, 2026, compared to 10.4 per cent a year ago. Credit from all sources grew by 16.3 per cent (y-o-y) in 2026-27 so far as compared to 12.2 per cent a year ago.
25 Sector-wise data indicates buoyant credit flows to retail and services sector. Industrial credit growth more than doubled vis-à-vis last year, supported by a surge in bank lending to large industries and persisting buoyant credit to MSMEs. Credit to agriculture also recorded sharp acceleration.
26 SCB Parameters: The outstanding credit and deposit increased by 18.13 per cent and 17.31 per cent on a y-o-y basis, respectively, as on September 15, 2026. The credit-deposit gap has narrowed to 81 basis points (bps) in the fortnight ended September 15, 2026, from over 89 bps in the corresponding period last year. The system-level Capital to Risk Weighted Assets Ratio (CRAR) of 17.87 per cent in June 2026 was well above the regulatory minimum level and higher than the previous year. Ratio of non-performing loans improved further (GNPA ratio at 1.67 per cent in June 2026 vis-à-vis 2.22 per cent in June 2025, NNPA Ratio at 0.39 per cent in June 2026 vis-à-vis 0.51 per cent in June 2025). Liquidity buffers were robust, with an LCR of 126.74 per cent as of end June 2026. The annualised return on assets (RoA) and return on equity (RoE) in June 2026 stood at 1.33 per cent (1.30 per cent in June 2025) and 13.26 per cent (13.02 per cent in June 2025), respectively. Net Interest Margin was 3.22 per cent for June 2026 (3.26 per cent in June 2025).
27 NBFC Parameters: Total CRAR of NBFCs was 25.50 per cent and Tier I CRAR was 23.66 per cent in June 2026, well above the minimum regulatory requirements. GNPA ratio has improved from 3.09 per cent in June 2025 to 2.50 per cent in June 2026, while NNPA ratio also improved from 1.00 per cent in June 2025 to 0.84 per cent in June 2026. RoA for the sector increased from 3.01 per cent in June 2025 to 3.37 per cent in June 2026. NIM has increased from 4.99 per cent in June 2025 to 5.39 per cent in June 2026.
28 India’s current account deficit stood at 0.5 per cent of GDP in Q1:2026-27 (US$ 4.2 billion), higher than 0.4 per cent of GDP in Q1:2025-26 (US$ 3.4 billion).
29 Services trade surplus stood at US$ 85.8 billion during April-August 2026 vis-à-vis US$ 79.9 billion during April-August 2025.
30 Net transfers, primarily comprising worker’s remittances, stood at US$ 53.9 billion during April-July 2026, higher than US$ 43.4 billion during April-July 2025.
31 Growth in merchandise exports at 22.8 per cent (y-o-y) to US$ 88.1 billion remained robust during July-August 2026, partly reflecting elevated margins on oil exports. The expansion was broad-based, with petroleum products, electronic goods and engineering goods being the major contributors. Petroleum product exports increased by 66.0 per cent (y-o-y) to US$ 13.8 billion (US$ 8.3 billion in July-August 2025). Engineering goods exports rose by 21.2 per cent (y-o-y) to US$ 24.6 billion (US$ 20.3 billion in July-August 2025). Electronic goods exports rose by 71.6 per cent (y-o-y) to US$ 11.5 billion (US$ 6.7 billion in July-August 2025). Merchandise imports grew by 15.8 per cent (y-o-y) to US$ 146.9 billion during July-August 2026, mainly driven by electronic goods and petroleum, crude and products. Electronic imports rose by 43.3 per cent (y-o-y) to US$ 28.0 billion during July-August 2026 (US$ 19.6 billion in July-August 2025). Petroleum, crude and products imports increased by 21.3 per cent (y-o-y) to US$ 35.0 billion during July-August 2026 (US$ 28.8 billion in July-August 2025).
32 According to the IMF’s WEO (July 2026), world goods and services trade volume growth is expected to moderate to 3.5 per cent in 2026 from 5.0 per cent in 2025.
33 Gross FDI flows to India grew by 20.6 per cent during April-August 2026-27. Net outward FDI increased by 26.5 per cent to US$ 17.7 billion during April-August 2026-27 from US$ 14.0 billion a year ago (y-o-y growth of 41.9 per cent).
34 In terms of globally announced greenfield FDI projects, India was ranked third during April-August 2026 with an amount of US$ 41.3 billion.
35 Net inflows under non-resident deposits rose sharply to US$ 119.2 billion during April-August 2026 from US$ 5.6 billion a year ago. During April-August 2026, gross ECB disbursements to India increased to US$ 23.9 billion from US$ 17.0 billion a year ago. Adjusting for ECB repayments and inter-corporate borrowings, net inflows rose to US$ 7.3 billion during April-August 2026 from US$ 4.7 billion a year ago.
36 As on October 2, 2026, India’s forex reserves stood at US$ 734.6 billion.
RESERVE BANK OF INDIA
October 07, 2026
Statement on Developmental and Regulatory Policies
October 7, 2026
Regulation
1. Measures to Enhance the Customer Convenience through the Account Aggregator Framework
With an objective to enhance customer convenience, it has been decided to implement interoperability among NBFC-Account Aggregators (NBFC-AA). This will enable customers to access and share their financial information, across different Financial Information Providers, through any NBFC-AA of their choice. Additionally, Depositories regulated by the Securities and Exchange Board of India are being facilitated to include information related to bank deposit accounts in their Consolidated Account Statement (CAS) through the NBFC-AAs. This will enable demat account holders to view information relating to their demat account holdings and bank deposit accounts at one place in the CAS. Customers, including those who do not have demat accounts, can continue to obtain a consolidated view of their financial information and share the same through the NBFC – AAs also. Both measures aim to enhance customer convenience and are expected to be implemented by December 31, 2026.
Financial Markets
2. Constitution of a Technical Consultative Committee for Financial Markets
Against the backdrop of rapidly evolving financial markets and infrastructure, the Reserve Bank has decided to constitute a Technical Consultative Committee for Financial Markets. The Committee will serve as a forum for structured engagement with market participants and stakeholders by the Reserve Bank on policy and operational matters related to money, government securities and foreign exchange markets as well as the respective derivative markets and infrastructure. The composition and the terms of reference for the Technical Consultative Committee shall be separately notified.
(Brij Raj)
Chief General Manager
Press Release: 2026-2027/1265
RESERVE BANK OF INDIA
October 07, 2026
Monetary Policy Statement, 2026-27
Resolution of the Monetary Policy Committee
October 5 to 7, 2026
Monetary Policy Decisions
The Monetary Policy Committee (MPC) held its 63rd meeting from October 5 to 7, 2026, under the chairmanship of Shri Sanjay Malhotra, Governor, Reserve Bank of India. The MPC members Dr. Nagesh Kumar, Shri Saugata Bhattacharya, Prof. Ram Singh, Dr. Poonam Gupta and Shri Indranil Bhattacharyya attended the meeting.
2. After a detailed assessment of the evolving macroeconomic and financial developments and the outlook, the MPC voted unanimously to increase the policy repo rate under the liquidity adjustment facility (LAF) by 25 bps to 5.50 per cent. Consequently, the standing deposit facility (SDF) rate stands adjusted at 5.25 per cent and the marginal standing facility (MSF) rate and the Bank Rate at 5.75 per cent. The MPC also decided to change the stance to calibrated tightening.
Growth and Inflation Outlook
Global Outlook
3. Since the last MPC meeting in August 2026, the re-escalation of the conflict in West Asia and the consequent sharp volatility in crude oil prices has kept the global economy in a state of flux. Global growth has remained resilient. Acceleration of inflation in key economies has prompted a shift towards hawkish monetary policy. The US Fed hiked by 25 bps in September. The Fed commentary thereafter along with rate tightening by major systemically important central banks have reinforced expectations of higher global policy rates. Tighter global financial market conditions coupled with fiscal sustainability concerns in major economies are keeping global bond yields at record high levels. With a resolution of the West Asia conflict remaining elusive, significant downside risks to the global outlook remain, including further tightening of global financial conditions, continuing elevated AI-related asset valuations and high public debt.
Domestic Outlook
4. Notwithstanding these persisting global headwinds, the Indian economy has remained resilient. As per National Statistics Office (NSO) estimates, real GDP growth in Q1:2026-27 at 7.8 per cent was higher than expected. Strong private consumption and fixed investment, rebound in merchandise exports and sustained buoyancy in services exports supported growth. On the supply side, the manufacturing sector grew at a robust pace. Services sector activity strengthened further, owing to buoyant domestic and external demand.
5. In Q2, available high frequency indicators for July-August suggest sustained momentum in domestic economic activity. Domestic demand remains resilient and is well supported by robust external demand with merchandise exports registering double-digit growth.
6. Looking ahead, global economic uncertainty will continue to have some bearing on domestic economic activity. While energy prices and supply chain pressures have continued, their near-term trajectory remains uncertain amidst the lingering West Asia conflict. Their adverse impact is being contained with active diversification of supply sources. Deficient south-west monsoon and strong El Niño conditions pose risks to agriculture sector’s outlook and rural demand, although healthy buffer of foodgrains and proactive policy interventions by the government are expected to mitigate the impact. Furthermore, continuing momentum in services and broadly stable employment conditions are likely to support urban demand. Strong capacity utilisation, robust credit flows and the government’s thrust on infrastructure are expected to sustain investment activity. While services exports are expected to remain buoyant, bilateral trade agreements should boost merchandise exports.
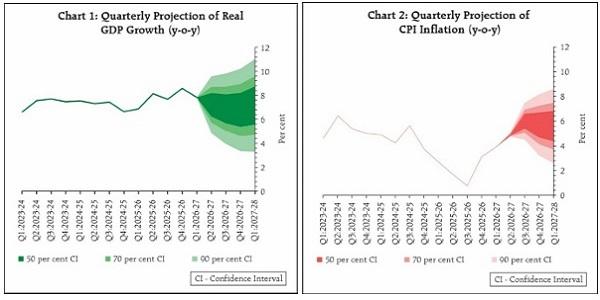
7. Taking all these factors into consideration, real GDP growth for 2026-27 is projected at 7.1 per cent, with Q2 at 7.2 per cent; Q3 at 6.9 per cent and Q4 at 6.8 per cent. Real GDP growth for Q1:2027-28 is projected at 7.1 per cent. The risks are evenly balanced (Chart 1).
8. CPI inflation increased to 4.8 per cent in August 2026 from 4.5 per cent in July. While the increase has been predominantly on account of higher inflation in food and fuel groups, core inflation has also picked up indicating some signs of widening price pressures. Food price increases have become more broad based along with notable spikes in certain items such as sugar and onion. The uptick in fuel inflation in August largely reflected unfavourable base effects. Core inflation increased to 4.2 per cent and core inflation, excluding precious metals, increased to 2.9 per cent in August. The weighted share of items in headline CPI recording inflation above 4 per cent increased steadily to about 37 per cent in August.
9. The near-term outlook on inflation points towards continued pressures from supply side on account of the deficient monsoon, ongoing El Niño conditions and high energy and other commodity prices, the pass through of which is still continuing. Considering all factors, CPI inflation is projected to be 5.2 per cent for 2026-27 with Q2 at 4.9 per cent; Q3 at 6.0 per cent; and Q4 at 5.7 per cent (Chart 2). Inflation for Q1:2027-28 is projected at 5.6 per cent with risks being evenly balanced. Core inflation is projected at 4.4 per cent for 2026-27.
Rationale for Monetary Policy Decisions
10. The MPC noted that the global context on account of geopolitical developments remains challenging. Nonetheless, the Indian economy has been strong. The economic momentum remains broad-based. The economy is expected to remain resilient.
11. In the light of available data, it is clear that inflation and its outlook are not benign as they were last year with headline CPI inflation expected to average almost 5.8 per cent in the next three quarters and core inflation projected at 4.4 per cent this year. In this milieu, recalibrating the policy rate is imperative.
12. As regards supply side inflation, monetary policy primarily acts by curtailing second round effects (inflation expectations and firm level pricing behaviour, etc.), which take time to manifest and are difficult to extract from available data. Apart from data related to inflation expectations and firm level pricing behaviour, indicators of generalisation of inflation like core inflation and diffusion indices are used for this purpose. It may, however, be kept in mind that it is difficult to distinguish between the second-round effects and the indirect impact of supply side pressures (in production cost through energy and other inputs) as both are present in these indicators. While there is some evidence of elevated inflation expectations and generalisation of inflation, there are only limited signs of supply side pressures getting embedded in pricing behaviour.
13. Similarly, while there is limited evidence of demand side pressures, risks in view of strong growth in monetary and credit aggregates exist.
14. Considering all these factors, the MPC unanimously voted to increase the policy repo rate by 25 basis points to 5.50 per cent. The MPC also decided to change the stance to calibrated tightening. It only signals that given the current conditions, rate cuts are off the table in the near term and policy action ahead can only be a rate hike or a pause, depending on the evolving conditions and the outlook. The duration and extent of rate hike cycle would be contingent on the actual growth-inflation developments and outlook, especially that of underlying inflation, the extent of broadening of price pressures and second round effects of the supply shock, as also the impact of demand impulses.
15. Two members – Dr. Nagesh Kumar and Prof. Ram Singh – were of the view that the stance be retained at neutral.
16. The MPC remains committed to its price stability mandate and will endeavour to progressively align inflation with its target.
17. The minutes of the MPC’s meeting will be published on October 21, 2026.
18. The next meeting of the MPC is scheduled for December 2 to 4, 2026.
(Brij Raj)
Chief General Manager
Press Release: 2026-2027/1264