Cost of Quality (COQ) can be defined as Costs associated with quality-related efforts and deficiencies- these include assuring, preventing, detecting, and re mediating product issues related to quality. Quality involves in creating, maintaining, upgrading and delivering a product having some standards that meets or exceeds the expectations of the customers.
In doing so, certain costs are incurred to perform quality related activities such as quality planning & management; Statistical Process Control; investments in quality related information systems; Inspection & Testing; Tracking the causes and effects of the problem; quality improvements; Monitoring Progress; Scrap and Rework Costs; Complaints & Warranty Costs etc.
Broadly Cost of Quality (COQ) can be classified into two categories –
- Cost of Conformance (COC) or Cost of Good Quality (COGQ) and
- Cost of Non-Conformance (CONC) or Cost of Poor Quality (COPQ).
Cost of Conformance (COC) or Cost of Good Quality (COGQ) can be defined as Costs associated with doing quality job, conducting quality improvements, and achieving quality goals. These are the costs that aim at assurance of quality and prevention of bad quality. That means Cost of Conformance has two sub-divisions : Cost of Assurance and Cost of Prevention.
Cost of Assurance : These costs are associated with the quality requirements, systems and procedures, control measures and audits to ensure appropriate quality standards are used and complied such as money spent on establishing methods and procedures; Process Capability Studies; robust Product Design; proper employee training in performing good quality job; supplier rating / supplier certification (assessment and approval of suppliers of products and services), Quality audits (confirmation that the quality system is functioning correctly) acquiring tools, and planning for quality. Quality assurance provides confidence in the system that ensures quality of deliverables.
Cost of Prevention : The costs that arise from efforts to keep defects from occurring at all- prevent errors to happen and to do the job right the first time. Prevention costs may include Costs of Verifications – checking of incoming material, processes, products, and services to ensure that they conform to agreed specifications; Preventive Maintenance; Calibration of measuring and test equipment etc. These are planned and incurred before actual operation and money is all spent before the product is actually built. The focus on prevention tends to reduce preventable costs of bad quality.
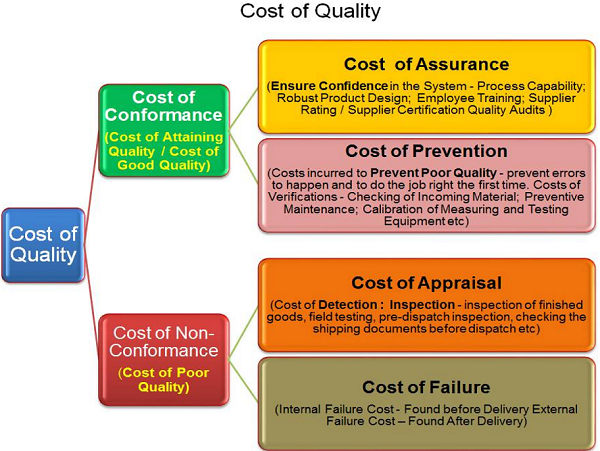
Cost of Non-Conformance (CONC) or Cost of Poor Quality (COPQ) is the costs associated with all activities and processes that do not meet agreed performance and / or expected outcomes. These costs would disappear if every task were always performed without deficiency. These costs have two sub-divisions : Cost of Appraisal and Cost of Failure.
Cost of Appraisal : Money spent to review completed products against requirements. Appraisal includes the cost of inspections, testing, and reviews. This money is spent after the product is built but before it is shipped to the user or moved into customers place. They could include: inspection of finished goods, field testing, pre- dispatch inspection, checking the shipping documents before dispatch etc
Cost of Failure : All costs associated with defective products produced and or that have been delivered to the user. These costs are further sub-divided into Internal Failure Costs and External Failure Costs.
Internal Failure Costs– These are the Costs generated before a product is shipped but after a product is made and inspected and found non-conformance to requirements, such as – Product/service design failure costs (internal – Design corrective action; Rework due to design changes; Scrap due to design changes); Purchasing failure costs (Purchased material reject disposition costs; Purchased material replacement costs; Supplier corrective action; Rework of supplier rejects; Uncontrolled material losses); Operations (product or service) failure costs (Material review and corrective action costs – Disposition costs – Troubleshooting or failure analysis costs (operations) – Investigation support costs – Operations corrective action; Operations rework and repair costs – Rework – Repair; Re-inspection / retest costs; Extra operations; costs of Scrap (operations); Downgraded end product or service; Internal failure – labour losses; Other internal failure costs
External Failure Costs—Costs generated after a product is shipped as a result of non-conformance to requirements, such as Complaint investigation / customer or user service; Returned goods; Retrofit costs; Recall costs; Warranty claims; Liability costs; Penalties; Customer/user goodwill; Lost sales; Other external failure costs
Cost of Quality as % of Sales:
Quality costs may arise in many ways and anywhere in a company. For Example the procurement department may acquire substandard components that may result in unacceptable final products. There may be product design issues that begin in the engineering department, as well as manufacturing problems that can create product flaws. In addition, the dispatch department may have incorrectly entered a customer order, so that the customer receives the wrong product. The accounts department may enter wrong credit to a different supplier’s account that may result in un-recoverable amount. These issues all result in quality costs.
These apart there are some costs incurred towards quality improvement efforts like streamlining processes for consistently delivering defect-free products or services on time; training people for quality consciousness; improve productivity levels; costs towards investments in quality related infrastructure & equipments.
Put together the Total Quality Costs may comprise a major portion of the total expenses of a business, many organizations have true quality-related costs as high as 15 to 25 percent of sales revenue, though mostly they are hidden within the normal cost and may not be visible fully and may not be recorded specifically.
Quality’s Effect on Income and Expenses
Quality related out comes (benefits or Loss) and costs can be treated in financial terms as Income and Expenditure as shown below.

Tangible & In-tangible – Visible & Hidden Costs of Quality:
There are some costs which are very visible and recorded in normal accounting systems like cost of customer rejections, cost of returns, inspection costs, cost of waste and scrap, testing costs, inspection costs, customer visits to resolve quality issues, discounts on defects; cost of re-work, cost of recalls and reverse logistics etc. These are tangible costs.
However there are many hidden costs which are invisible (mostly un-recorded or un-estimated or un-measurable) like delays and stoppages caused by defectives; customer goodwill / reputation; strained customer relationships and loss of future sales orders; loss of morale due to frictions between departments; cost of complaints handling; un-used or idle capacity due to faults; excessive employee turnover; incomplete sales order; development costs of failed products etc.

Major “ICEBERG Costs” are hidden. We need to find out and minimize those costs
Cost of Quality & Time of Incidence
From the below chart we may observe that the cost due to quality related failure go on increasing as the failure is found in later stages of process or product cycle. Cost of prevention is lowest and the cost is going on increasing as the failure is found subsequently in design phase or manufacture or final product inspection or at customers place or claims arise. Therefore it is better to prevent quality related problems at the early stages otherwise the cost of non- compliances shall go high.

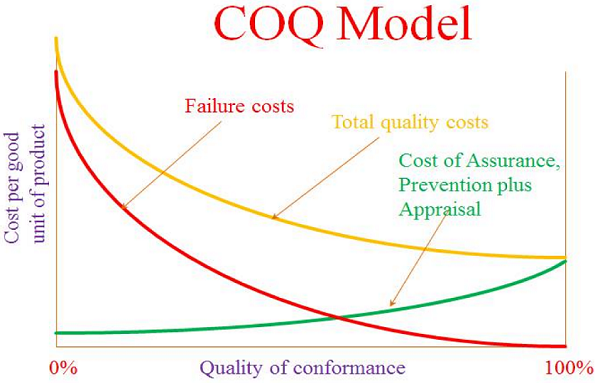
COQ Model :
Quality is an investment and therefore quality efforts must be financially accountable. It is not the measurement, but the analysis and comparison for monitoring, control and strategic decisions that we can use the measured COQ. Applying the concepts of COQ measurement, analysis and corrections consistently can help reduce the cost of quality.
The Cost of Quality (COQ) model constructs a chart displaying prevention, appraisal, and failure costs over time in order to demonstrate the cost of poor quality. The model is based on the theme that prevention is better than cure. As we make more investments in quality assurance and prevention activities, then the incidents of failures will come down resulting in drastic reduction in total cost of failure. Cost of failure will not incur if the quality is free from faults. At this point the total cost of quality becomes equal to cost of quality assurance plus cost of prevention. Therefore it is worth to make investments in quality assurance and prevention efforts which yield more benefits by reducing quality faults. This model provide better clarity on the CoQ-metric and it’s constituents – the understanding of which is essential for establishing a quality management strategy for the organization to improve quality of products, services and ultimately the brand image.
Goals of COQ:
As seen from the above chart with increasing investment on Cost Assurance and Prevention activities the Cost of Failure is drastically falling down and resulting in overall reduction in Total Quality Cost. Therefore the objective of Cost of Quality is to increase in the Investments on Quality Assurance and Prevention activities.

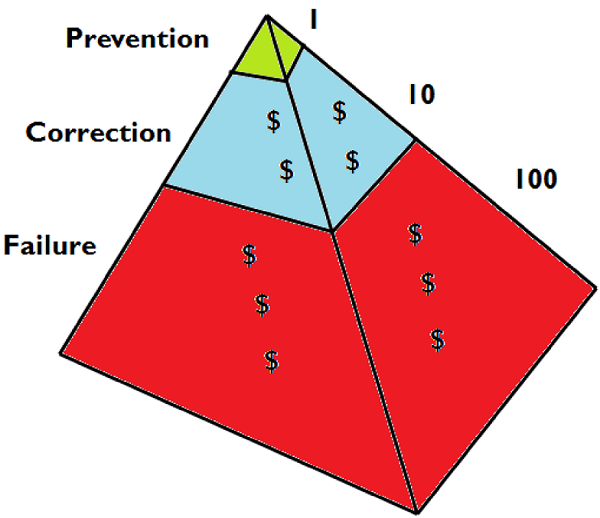
The 1-10-100 Rule :
As per this rule one dollar spent on prevention will save $10 on appraisal and $100 on failure costs. This rule helps one to prioritize expenditure on prevention, which is sure to bring in greater returns.
Measuring Cost of Quality :
The mitigation of quality issues can greatly increase the profitability of a business, as well as enhance the level of customer satisfaction. However the moot questions are how to measure cost of quality or failure?; How to measure Return on Quality when business is spending money on quality? To answer these we have to apply fundamental business management concepts, including financial principles, to the measurement of quality.

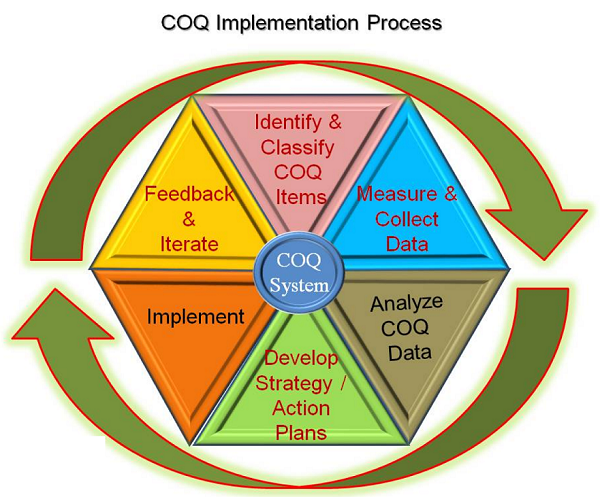
Steps in measurement of Cost of Quality :
- Identify COQ item
- Determine Category of Quality Cost
- Create Measurement System that captures categories of quality costs
- Collect the Data
- Analyze the Data
- Take Strategic Decisions about Investments on quality improvements with the objective of reducing COQ and maximizing benefits.
- Take Feedback and Iterate
The quality cost can be measured through various quality indicators and expressed in terms of cost like value/cost, time (usually linked to cost of labor) and quality of work results etc. For example cost of rework can be measured by multiplying number of man hours spent for the rework by labour rate and material cost if any may be added. Cost of customer rejected and returned material can be calculated by adding all costs associated with material, transactional & logistics and other miscellaneous costs. Similarly quality related training cost can be worked out by assigning all costs related to such training. In this fashion category wise costs can be worked out and assigned.
Analysis of Cost of Quality provides insight into the effectiveness of the management of quality and a means of determining problem areas, opportunities, savings, and action priorities.
Return on Quality (ROQ) : Minimizing Cost of Quality : Maximizing Profits
ROQ – an approach that evaluates the financial return of investments in quality. Poor quality causes higher costs of products or services and at the same time also leads to customer dissatisfaction and loss of business. Reducing or eliminating the cost of poor quality is one of the best ways to increase a company’s profit.
Edwards Deming proposed that improving quality reduces cost and improves profitability. Therefore investments on improving quality has greater positive returns in terms of increased sales, getting Repeat Orders, expanding Customers base, Commanding better Prices, gaining Competitive Advantage, getting opportunity in Business Expansion.

Returns on Quality is maximized when benefits of improved quality is more with minimal investments on quality.

From the chart below it is evident that by improving quality efforts of Assurance and Prevention, though there is small increase in these costs, the associated costs of quality failure and appraisal are drastically fallen down and therefore sharp fall in total quality cost resulting in net benefits.

Quality improvements can lead to benefits of net cost reductions. Net Cost of Quality is the difference of cost conformance and savings by avoiding non-conformance. That is by making investments in quality assurance and prevention efforts lead to net cost savings as cost reductions on account of quality non-compliance is much more than the cost incurred on assurance and prevention activities.

Quality in Place for Each Function
Management must manage the different business functions in a manner that will provide maximum benefit to all parties concerned. These functions are inter-dependent and must be managed continuously to reap maximum benefits. The quality of performance of these functions is important so as to stay competitive, and must be monitored and evaluated. Therefore, quality systems must be in place for each function may it be General Management; Procurement & Logistics; Marketing; Production; Financial; Human Resources; Public Relations; Administration; Risk Management; IT Management or Information/Knowledge Systems. Quality is pervasive everywhere and impacts every business and in turn everyone’s life.
Conclusion :
An important conclusion drawn from this paper is that understanding of the cost of quality is extremely important for any business in establishing an organizational quality management strategy and making calculated decisions of investing on quality related improvements and grab ample opportunities to show case the quality image.

Author Bio


