
SEBI’s “Study on Exit Behaviour of Anchor Investors in Mainboard IPOs” examines anchor investor exit behaviour in 242 mainboard IPOs listed during April 2022 to October 2025, using allotment, depository holding and closing price data across holding dates at 29, 33, 60, 93, 180 and 365 days from allotment; the extended analysis covers 167 IPOs listed through 2024. FPIs accounted for 43.8% of anchor allotment value and MFs 38.5%. Aggregate weighted exit was 3.2% at T+30, around 8% at T+60 and approximately 17.3% at T+90, while the smallest ₹0–250 crore issues recorded the highest exits. FPIs showed higher exit intensity than MFs, reaching approximately 20% versus 15% by T+90. The study reports a broadly negative price relationship at the 30-day window as exit intensity increased, with mean price impact moving from approximately −0.4% for exits up to 2.5% to −3.5% for exits above 10%; the 90-day impact was more muted. For 167 IPOs, weighted exit increased to 50.7% by T+365, with FPIs exiting approximately 60% and MFs 38% of their aggregate anchor allotments.
Securities and Exchange Board of India
Study on Exit Behaviour of Anchor Investors in Mainboard IPOs
Laltu Pore, Pampana Hari Nayak Akshay1
SEBI- Aug 13, 2026 | Reports : Reports for Public Comments
Click here to provide your comments
Executive Summary
The study undertakes a comprehensive empirical examination of anchor investor exit behaviour in mainboard IPOs listed on Indian stock exchanges during the period April 2022 to October 2025. Anchor allotment, depository holding and closing price data for 242 Mainboard IPOs listed during the said period, has been analysed.
The analysis is designed around six holding dates- 29, 33, 60, 93, 180, and 365 days from the date of allotment for each ISIN, to study the exit behaviour around prescribed lock-in windows as well as the long term holding behaviour. The primary exit analysis covering the two lock-in windows, has been conducted for the 242 IPOs. The extended exit analysis (beyond the prescribed lock-in windows) covers 167 IPOs listed till the close of CY2024.
Key Findings
These findings relate to 242 mainboard IPOs listed during the period April 2022 to October 2025:
Anchor Portion Allotment – By Investor Category
- The anchor investor universe is dominated by FPIs (43.8%) and MFs (38.5%) in terms of allotment value. Other QIBs (Insurance companies, banks etc.) contribute 10.5%, AIFs 5.3%, and Body Corporates a marginal share.
- AIFs, Other QIBs, and Body Corporates account for significant anchor portion in smaller issues. As issue size increases beyond ₹1000 crore, AIF and Body Corporate presence shrinks sharply and the allotment becomes a near-binary split between FPIs (~45–47%) and MFs (~38–42%), with Other QIBs filling the residual 9-12%.
Aggregate Anchor Exit Behaviour – Group level
- Anchor exit rates are low at aggregate levels: the weighted aggregate exit percentage immediately post the first unlock event (T+30)2 was 3.2%, which rose to around 8% by T+60, and approximately 17.3% past the second unlock event (T+90). This indicates that while exit is gradual and cumulatively significant, anchor investors hold majority of the anchor portion even beyond prescribed lock-in windows.
- An inverse relationship is observed between issue size and exit rates. The cohort of smallest issues (₹0-250 crore) shows the highest exit after 30 days at 9.1%, exit at T+60 (20.3%), and the exit after 90 days at 32.4%, substantially higher than all other size categories.
Anchor Exit Behaviour – ISIN level
- At First Exit, the majority of ISINs (192 out of 242) recorded an exit of less than 25% of the anchor portion, indicating that most IPOs experience some but limited anchor exit immediately after the first unlock. 43 ISINs showed zero first exit, and only seven ISINs witnessed an exit of more than 25%.
- By Second Exit, 171 ISINs recorded an exit of less than 25% of the anchor portion, 58 ISINs an exit within 25-50%, and 12 ISINs more than 50% exit, though none witnessed 100% exit. Only one ISIN showed zero second exit, meaning that by the 90-day mark, anchor exit is near-universal across the IPOs, even as the quantum of exit remains modest for most IPOs.
Anchor Exit Behaviour – By Investor Category
- At the aggregate level, FPIs exited 3% of their anchor allotment during the first exit window. By the 60-day mark, the cumulative exit was 9%, which rose to 20% post second exit window. On the other hand, MFs showed a cumulative exit of 3% (first exit), 7% (by T+60), and 15% (second exit). AIFs and Body Corporates showed exit rates comparable to FPIs despite smaller allotment sizes. Other QIBs tended toward lower exit rates comparable to MFs.
- Distribution plots of ISIN-level exit percentages by FPIs and MFs reveal that at every exit stage, FPIs have a higher median exit percentage, wider IQR (inter quartile range), and heavier upper tail than that of MFs, suggesting that FPIs exit more as compared to MFs.
Price Impact at Exit Windows
- The analysis indicates a directionally negative relationship between anchor exit intensity (particularly at higher exit rates i.e. >10%) and price performance during the first unlock window, consistent with the supply pressure mechanism.
- For the stocks with more than 10% exit during the first unlock window, FPIs were the largest contributor at 24.5% average exit while MFs showed only 11.5% average exit.
- Price impact during the 90-day unlock window is generally more muted than at the 30-day window.
Exit Behaviour – Until 365 days from Allotment Date (For 167 ISINs)
- The aggregate weighted exit rose from approximately 4% at T+30 to 9% by T+60, 19% by T+90, 34% by T+180, and 51% by T+365.
- By one year from allotment, approximately half of aggregate anchor allotment value has been disposed of across the anchor investors’ portfolio, indicating that the prescribed exit windows capture only a fraction of eventual anchor selling.
- By T+365, FPIs exited approximately 60% of their aggregate anchor allotment, the highest for any category. Body Corporates exited 58%, AIFs (55%), Other QIBs (46%), and MFs the lowest exit of 38%.
- The FPI-MF exit divergence visible at T+90 (FPI ~21% vs MF ~15%) widens substantially by T+365 (FPI ~60% vs MF ~38%).
Study on Exit Behaviour of Anchor Investors in Mainboard IPOs
1. Introduction
1.1 Anchor Investor Mechanism in Indian Mainboard IPOs
The anchor investor framework is a cornerstone of India’s public equity issuance architecture, designed to instil confidence and facilitate price discovery in Initial Public Offerings (IPOs). Anchor investors are Qualified Institutional Buyers (QIBs) who are allocated shares in a mainboard IPO on a discretionary basis by the issuer, in consultation with the Book Running Lead Managers (BRLMs), one day prior to the opening of the IPO subscription period. This pre-IPO allocation serves the dual purpose of signalling institutional endorsement of the offering and stabilising demand during the subscription period.
The rationale underlying the anchor investor mechanism is grounded in the informational asymmetry inherent in IPOs. By securing participation from large, sophisticated institutions at the outset, issuers aim to mitigate the ‘winner’s curse’ problem for retail and non-institutional investors. The visible commitment of reputed institutions provides a quality signal, potentially reducing the under-pricing necessary to attract broader investor participation.
1.2 Regulatory Framework
1.2.1 Eligibility and Allocation
The anchor investor framework is governed by the SEBI (Issue of Capital and Disclosure Requirements) Regulations, 2018 (ICDR Regulations). The key regulatory provisions relating to anchor investors are as follows:
- Anchor investors must be QIBs as defined under the ICDR Regulations. An anchor investor shall make an application of a value of at least ten crore rupees in a public issue on the main board made through the book building process.
- The allocation to anchor investors is made from the QIB portion of the IPO.
- Under Regulation 6(1), not more than 50% of the net offer can be allocated to QIBs. Whereas under Regulation 6(2), applicable to certain issuers, at least 75% of the net offer must be allocated to QIBs.
- Up to 60% of the portion available for allocation to QIBs, shall be available for allocation to the anchor investors.
- A minimum of 2 and maximum of 15 anchor investors shall be permitted for allocation up to two hundred fifty crore rupees, subject to minimum allotment of five crore rupees per such investor.
- In case of allocation above two hundred fifty crore rupees, a minimum of 5 such investors and a maximum of 15 such investors for allocation up to two hundred fifty crore rupees and an additional 15 such investors for every additional two hundred fifty crore rupees or part thereof, shall be permitted, subject to a minimum allotment of five crore rupees per such investor.
1.2.2 Lock-in Requirements
To ensure that the commitment of anchor investors is substantive, SEBI has prescribed a mandatory lock-in period for shares allotted to anchor investors:
- Originally, the entire anchor allocation was subject to a uniform 30-day lock-in period from the date of allotment, preventing any exit within 30 days from the date of allotment.
- Following amendments to the ICDR Regulations (w.e.f. April 01, 2022), the lock-in was bifurcated: 100% of the allotted shares are locked in for 30 days from the date of allotment (the ‘first lock-in’), and 50% are locked in for 90 days from the date of allotment (the ‘second lock-in’). This bifurcated structure was introduced to stagger any potential selling pressure from anchor investors.
1.2.3 Observation Windows in This Study
Given the lock-in framework, the study is designed around six critical holding-date snapshots: labelled a29, a33, a60, a93, a180, and a365- representing demat holdings approximately 29, 33, 60, 93, 180, and 365 days from the date of allotment. These dates are chosen to capture:
- a29: Holdings just before the expiry of the 30-day lock-in (end of first lock-in period).
- a33: Holdings a few days after the expiry of the first lock-in (immediate post-first-unlock behaviour).
- a60: An intermediate holding snapshot (mid-way between the two unlock events).
- a93: Holdings just after the expiry of the 90-day lock-in (post-second-unlock behaviour).
- a180 and a365: Long-term holding behaviour, capturing whether anchors maintain exposure beyond the prescribed lock-in period.
1.3 Objectives of the Study
This study undertakes a comprehensive empirical examination of anchor investor exit behaviour in mainboard IPOs listed on Indian stock exchanges during the period April 2022 to October 2025. The specific objectives are:
- To document the allotment pattern of anchor investors across investor categories, issue size buckets, issue types (under Regulation 6(1) or 6(2) of ICDR), and calendar years.
- To quantify the magnitude of exit by anchor investors at each key unlock window at both aggregate/ group level and ISIN (issue) level.
- To disaggregate exit behaviour by investor category: Mutual Funds (MF), Foreign Portfolio Investors (FPI), Alternative Investment Funds (AIF), Other QIBs (Banks, Insurance companies etc.), and Body Corporates.
- To examine the price impact of anchor investor exits around the 30-day and 90-day lock-in expiry windows.
2. Data and Methodology
2.1 Universe of IPOs
The initial universe for the study comprised 254 mainboard IPOs listed on Indian stock exchanges (BSE/NSE) during the period April 2022 to October 2025, as recorded in the allotment data sourced from Registrars and Transfer Agents (RTAs). Each IPO is identified by its ISIN (International Securities Identification Number).
2.2 Data Sources
The study draws on two primary data sources:
- Allotment Data: Consolidated allotment records obtained from RTAs covering 254 mainboard IPOs. This dataset contains anchor investor-level allotment data including investor name, PAN, ISIN, number of shares allotted, and allotment amount.
- Holding Data: Depository-based holding data, providing beneficial owner-level share holding positions at six pre-defined date snapshots (a29, a33, a60, a93, a180, a365) for each ISIN and each client account. Fields include ISIN, PAN, client ID, depository participant token, holding balance columns (current balance, total locked balance, total unlocked balance), allotment flag (identifying the snapshot), holding date, and client category code.
- Closing Price Data: Daily adjusted closing price data for all IPO stocks, covering April 2022 to January 2026, used for price impact analysis around exit windows.
2.3 Data Processing and Validation
2.3.1 Holding Data Cleaning and Validation
The holding data underwent the following cleaning and validation steps before analysis:
- PAN-level Aggregation: Multiple demat accounts belonging to the same PAN for a given ISIN were consolidated at the PAN level by summing balance columns across client IDs.
2.3.2 Category Data Cleaning
Client category codes from the holding data were cleaned as follows:
- Category Inconsistency Resolution: Each PAN-Depository Token pair was checked for uniqueness of category. Where a single PAN was assigned multiple categories across different depository accounts, the category linked to Depository Token 1 (NSDL) was retained.
- Specific Corrections: Few specific PANs were identified as having been incorrectly coded as category 5 (Body Corporate) and were reclassified to category 14 (FPI) based on additional verification.
2.3.3 Anchor Portion Derivation from Holding Data
The cleaned holding data was pivoted at the PAN-ISIN level, with separate columns for each of the three balance types at each of the six snapshot dates (e.g., a29_curr, a29_lck, a29_unlck, …, a365_curr, a365_lck, a365_unlck). The anchor portion for each PAN-ISIN record was computed as:
anchor_portion = a29_locked_balance − a93_locked_balance (Given that any lock-in shares (except for anchor portion) remains locked after 90 days)
2.3.4 Cross-Source Reconciliation
To validate the integrity of holding data against allotment data, a systematic cross-source reconciliation was performed:
- ISIN-level reconciliation: For all ISINs common to both sources, the sum of anchor_portion derived from the holding data was compared to the sum of shares allotted from the allotment data. ISINs with discrepancies (i.e., the Difference ≠ 0) were identified and excluded from the final analysis universe.
- Final working dataset: After excluding ISINs with material cross-source discrepancies (12 in number), the final analysis dataset was constructed from the remaining 242 validated ISINs.
2.4 Exit Metric Computation
For the purpose of exit metric computation, it is assumed that when an anchor investor (identified by PAN) sells his/her anchor shares once, it is considered exit even if he/she repurchases them after some days. However, if such investor exited and repurchased shares within any two consecutive dates of the six holding dates pre-defined (say between a33 and a60), then those shares are not considered as exited.
Subject to the above assumption, three exit metrics were computed at the PAN-ISIN level and then aggregated to the ISIN level:
- First Exit: anchor_firstexit = max(0, anchor_portion − a33_current). This captures shares sold in the immediate window after the first lock-in expiry.
- Exit at Day 60 (Intermediate): anchor_exit60 = max(0,anchor_portion − a60_current). This cumulative measure captures exits between the first unlock and the 60-day snapshot.
- Second Exit (90-day): anchor_secondexit = max(0, anchor_portion − a93_current). This captures the cumulative shares sold between the first and second unlock.
A floor of zero was applied to all metrics to prevent negative values arising from share acquisitions (or buy transactions) by anchor investors that may occur after allotment, which would otherwise distort exit calculations.
Exit percentages at the ISIN level were computed as:
First Exit % = (anchor_firstexit / anchor_portion) × 100 -> (Exit from T+29 through T+33) Exit 60 % = (anchor_exit60 / anchor_portion) × 100 -> (Exit from T+29 through T+60) Second Exit % = (anchor_secondexit / anchor_portion) × 100 -> (Exit from T+29 through T+93), T being the allotment date
Exit percentage (at any stage) at the aggregate level (i.e. for a set of ‘n’ ISINs) was computed with anchor allotment value as weights as under:

2.5 Category Classification
For category-wise analysis, client category codes from the holding data were mapped to the following five investor groups:
| Investor Category | Category Codes | Description |
| MF (Mutual Fund) | 8 | Domestic mutual fund schemes |
| FPI (Foreign Portfolio Investor)
|
3, 14 | Foreign portfolio investors (all categories) |
| AIF (Alternate Investment Fund)
|
15, 22 | Category I, II and III AIFs |
| Other QIB | 18 | Insurance companies, banks etc. |
| Body Corporate | 5, 9, 10, 25, 29 | Domestic corporate entities |
2.6 Price Impact Analysis
Closing price data for the ISINs under study, was extracted from CMIE Prowess IQ database, for the period April 2022 to January 2026.
Closing prices were fetched for each ISIN at each of the key date snapshots (a29, a33, a60, a89, a93). A tolerance of up to ±3 trading days was used when the exact calendar date did not correspond to a trading day, with the following directional rule: for the a29 date, the closest preceding trading day price was used; for all other dates, the closest subsequent trading day price was used.
Price change metrics were computed as:
- pct_a29_to_a33: Percentage change from price at T+29 to price at T+33 (price movement during the first unlock window).
- pct_a89_to_a93: Percentage change from price at T+89 to price at T+93 (price movement during the second unlock window).
For the price impact analysis, the ISIN-level exit summary was merged with the price data to create a combined dataset used for price impact analyses.
2.7 Exit Analysis – Extended Until 365 days from Allotment Date
The primary exit analysis covers the two exit windows, prescribed by regulation: the first tranche at T+30 and the second tranche at T+90, T being the date of allotment. To obtain a complete picture beyond the prescribed exit windows, the study was extended to track cumulative exit at T+180 and T+365 using available demat holding snapshots.
2.7.1 Construction of 180-Day and 365-Day Exit Metrics
Cumulative exit at T+180 (anchor_exit180d) is constructed from the holding balance at the a180 snapshot.
Cumulative exit at T+365 applies a three-case logic:
| If anchor_portion >= a180_curr:
anchor_exit365 = anchor_exit180 + max(0, a180_curr − a365_curr); else if a365_curr < anchor_portion < a180_curr: anchor_exit365 = max(0, anchor_portion − a365_curr, anchor_secondexit); else: anchor_exit365 = anchor_exit180 |
2.7.2 Dataset Scope
The extended analysis covers IPOs listed up to 2024 (n=167 ISINs), as 2025 cohort IPOs had not completed the one-year snapshot date, at the initiation stage of the analysis. Complete a180 and a365 holding data is available for all 167 ISINs.
3. Findings
3.1 Allotment Statistics
3.1.1 Overview of the Allotment Universe
The allotment dataset, sourced from RTAs, originally covered 254 mainboard IPOs listed during April 2022 to October 2025. After cross-source reconciliation with the holding data (which required every ISIN’s aggregate anchor allotment to match exactly between the two sources), a subset of ISINs (242 IPOs) was retained for the exit analysis.
The allotment universe spans a wide range of issue sizes, classified into six buckets: ₹0–250 crore, ₹251–500 crore, ₹501–1,000 crore, ₹1,001–2,500 crore, ₹2,501–5,000 crore, and above ₹5,000 crore.
3.1.2 Category-wise Distribution of Anchor Allotment
Figure 1 presents the category-wise distribution of anchor allotment across four dimensions: overall (across 242 validated IPOs); issues made under regulation 6(1): the profitability route, and those made under regulation 6(2): the non-profitability route; by issue size bucket; and by calendar year. The following patterns are observable from the charts:
- FPIs were the single largest category of anchor investors by allotment value at 43.8%, followed by MFs at 38.5%. Together they accounted for over 82% of total anchor allotment value. Other QIBs contributed 10.5%, AIFs 5.3%, and Body Corporates a marginal share.
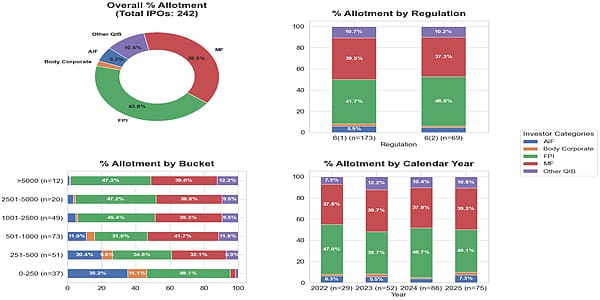
Figure 1: Category-wise Anchor Allotment: Overall, by Regulation, by Issue Size Bucket, and by Calendar Year
- The FPI dominance holds across issues made both under Regulation 6(1) & 6(2): 41.7% under Regulation 6(1) (n=173 IPOs) and 46.5% under Regulation 6(2) (n=69 IPOs). MF share in allotment value was 39.5% and 37.3% respectively.
- Issue size has a pronounced effect on allotment composition. In the smallest bucket (₹0–250 crore, n=37), AIFs accounted for 35.2% of anchor allotment value – by far their highest share across any bucket. In the ₹251–500 crore bucket, AIFs contributed 20.4% and Body Corporates 5.8%. As issue size increases beyond ₹1000 crore, AIF and Body Corporate participation shrinks sharply and the allotment becomes a near-binary split between FPIs (~45–47%) and MFs (~38–42%), with Other QIBs filling the residual 9-12%. This indicates that AIF participation is dominant in smaller IPOs.
- Throughout the period, the allotment mix has been remarkably stable. FPI share ranged from 39.7% to 47.0%, while MF share ranged from 37.8% to 39.7%.
3.2 ISIN-Level Exit Analysis
3.2.1 Aggregate Exit Behaviour – at Group level
Figure 2 presents weighted exit percentages at the three key windows, with anchor allotment value used as weights (refer to section 2.4). The following findings emerge:
- Exit rates are low at aggregate levels (panel i): the weighted aggregate exit percentage immediately post the first unlock event (T+30)3 was 3.2%, which rose to around 8% by T+60, and reaching approximately 17.3% past the second unlock event (T+90). This indicates that while exit is gradual and cumulatively significant, the majority of the first-tranche free anchor portion (i.e. 50%) remains held even post second exit on an aggregate weighted basis.
- Exit rates showed a clear and consistent step-up across all exit stages: First Exit < Exit 60d < Second Exit, indicating that anchor investors utilise the entire period between the two unlock events for staggered disposal rather than concentrating selling at either unlock point alone.
- The exit pattern is broadly similar between issues made under Regulation 6(1) and 6(2) (see panel ii). First Exit was approximately 3% for both categories, rising to ~8% at 60 days. At the 90-day mark, issues made under Regulation 6(1) recorded an exit of approximately 18.5% while those made under Regulation 6(2) showed ~15.3%, suggesting marginally lower cumulative exit in the latter.
- By issue size (panel iii heatmap), an inverse relationship exists between issue size and exit rates. The smallest bucket (₹0–250 crore) showed the highest First Exit (9.1%), Exit 60d (20.3%), and Second Exit (32.4%), substantially higher than all other size categories. Exit rates declined as issue size grew, with the ₹1,001–2,500 crore bucket showing the lowest first exit rate (2.6%). The very large buckets (₹2,501–5,000 crore and >₹5,000 crore) showed slightly higher second exit rates (~18–19%) than mid-large buckets, possibly reflecting reflect specific IPO or market dynamics in those cohorts.
- The year-wise trend (panel iv) reveals important temporal variation. The 2022 cohort of IPOs (n=29) showed the lowest second exit (~10%), while the 2023 cohort (n=52) witnessed the highest at approximately 24%, suggesting relatively aggressive exit by anchors from IPOs listed in 2023. Exit rates moderated in IPOs listed during 2024 (~19%) and 2025 (~15%), indicating a more settled anchor behaviour in recent years.
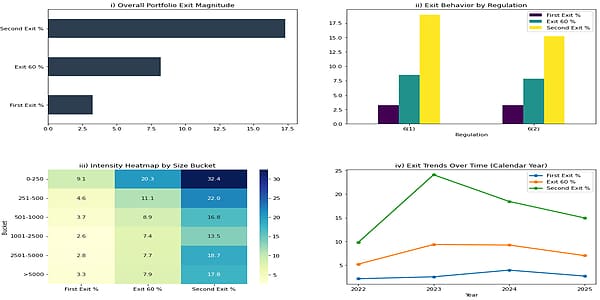
Figure 2: Weighted Exit Percentages: Overall, by Regulation, by Issue Size Bucket, and by Calendar Year
3.2.2 Distribution of Exit Percentages by Issue Size – At ISIN level
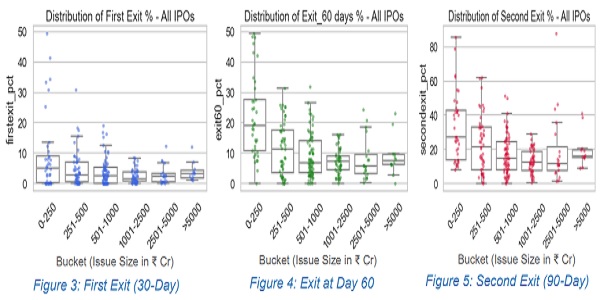
Figures 3, 4, and 5 present box-and-strip plots of ISIN-level exit percentages at the First Exit, Exit-60, and Second Exit stages by issue size bucket. These plots show actual per-ISIN exit percentages, revealing within-bucket dispersion.
- First Exit (Figure 3): Exit percentages across all buckets were low, with medians clustered in the 2-6% range. The smallest bucket (₹0-250 crore) had the widest spread and the highest median, with outlier ISINs reaching 40-50% first exit levels. In contrast, mid and large buckets (₹1,000 crore and above) had tighter distributions concentrated near zero, indicating that very little immediate exit occurs in larger IPOs.
- Exit-60 Day (Figure 4): The interquartile ranges expanded materially across all size buckets compared to the First Exit stage, indicating significant incremental disposal between T+33 and T+60. The smallest bucket (₹0-250 crore) showed a median exit of approximately 20% with several ISINs recording an exit of 40-50%. Larger buckets showed medians of approximately 5-10%. The dispersion of exit behaviour is substantially larger at this stage (especially for smaller issues), underscoring that the entire 30-to-60-day window is used for exit, rather than immediate exit after the lock-in expiry.
- Second Exit (Figure 5): The scale of disposal by T+93 was relatively higher across all buckets. The ₹0-250 crore bucket showed median second exit approaching 30% with outliers up to 80%. Even in larger buckets, medians were typically in the 10-20% range.
The data from the box plots suggest that the anchor portion disposal occurs gradually between the first and second unlock events and bulk of the anchor allotment remains held even beyond the lock-in expiry windows.
3.2.3 Classification of ISINs by Exit Intensity
Figure 6 classifies all 242 ISINs into five exit buckets (based on intensity of the exit) at each of the three stages, providing an ISIN count-based picture of how exit intensity evolves over time.
- At First Exit, the vast majority of ISINs (192 out of 242) featured in the >0% to ≤25% bucket, indicating that most IPOs experience some but limited anchor exit immediately after the first unlock. 43 ISINs showed zero first exit (anchor investors held the full unlocked anchor shares through T+33), and just seven ISINs were in the >25–50% bucket.
- By T+60, 214 ISINs featured in the >0-25% bucket, 19 ISINs moved into the >25–50% bucket, and 9 ISINs showed zero exit (down from 43), implying that many previously inactive anchor investors began selling between T+33 and T+60.
- By Second Exit, the distribution shifted further rightward: 171 ISINs remained in the >025% bucket (down from 192), 58 ISINs moved into the >25-50% bucket, and 12 ISINs exceeded 50% exit, though none reached 100%. Only one ISIN showed zero second exit, meaning that by the 90-day mark, anchor exit was near-universal across the IPOs, even as the quantum of exit remained modest for most IPOs.
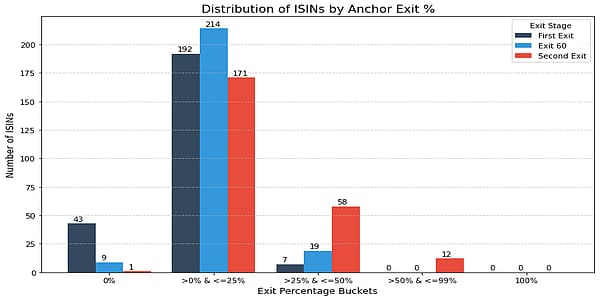
Figure 6: Distribution of ISINs by Anchor Exit Percentage: First Exit, Exit-60, and Second Exit
3.3 Category-wise Exit Analysis
3.3.1 Exit Behaviour by Investor Category
Figure 7 presents category-wise stacked bar charts showing the distribution of IPOs across exit intensity buckets (0%, >0–25%, >25–50%, >50–99%, 100%) for each investor category (as % of its respective anchor allotment) at each exit stage. Figure 8 (top panel) shows the weighted exit intensity (%) by category. Together these charts reveal starkly different exit behaviours of various investor categories:
- FPIs were the most notable exiters among all investor categories. At the First Exit stage, 68 IPOs showed zero FPI exit (far fewer zero-exit ISINs than any other category), while 158 IPOs registered FPI exit in the >0–25% range. The >25-50% bucket had 9 FPI entries at 30 days. By the Second Exit, the FPI exit distribution shifted heavily: only 11 IPOs showed zero FPI exit, 128 fell in the >0–25% range, 73 in >25– 50%, and 21 in >50–99%, with 3 instances of 100% exit. This highly progressive exit behaviour over time signals FPIs as the dominant source of selling pressure.
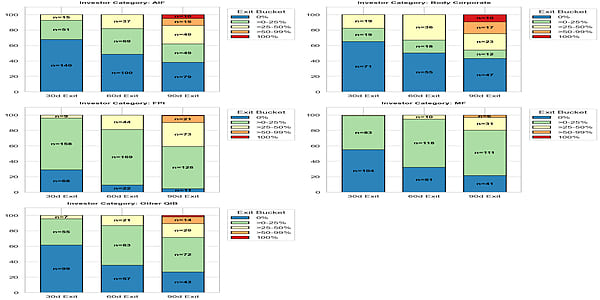
Figure 7: Category-wise Exit Summary (%): Participation, Allotment, and Weighted Exit Percentages
- Mutual Funds were notably more conservative than FPIs. Post the first lock-in expiry, 104 IPOs showed zero MF exit (among the highest zero-exit counts) and 83 IPOs were in the >0–25% bucket. Even by the 90-day stage, MF exit remained more restrained: 41 zero-exit IPOs, 111 in >0–25%, 31 in >25–50%, and only 6 in >50–99%, with no 100% exit instances. This indicates MFs are more patient holders of their anchor allocations.
- The weighted exit intensity chart (Figure 8, top panel) corroborates the FPI vs. MF comparison: FPI first exit intensity (~3.2%) was slightly higher than MF (~2.8%), but the gap widens at Exit 60d (FPI ~9.3% vs. MF ~7.0%) and Second Exit (FPI ~19.8% vs. MF ~14.7%). FPIs exited approximately 35% more of their anchor allocation by the 90-day mark compared to MFs on a weighted basis.
- AIFs showed the second highest exit intensity, as % of their allocation, on a weighted basis (~4.4% at 30 days, ~9.9% at 60 days, and ~19.6% at 90 days). However, their anchor book contribution was much lower (dominant only in smaller IPOs), so their market impact in aggregate value terms was limited. Further, in significant number of IPOs, AIFs showed zero exit: 140 IPOs at first exit, 100 IPOs by 60-day mark and 79 IPOs at second exit.
- Body Corporates exhibited the highest weighted exit intensity of all categories (~9.4% at 30 days, ~14.5% at 60 days, ~23.3% at 90 days). Their total value sold (Figure 8, bottom panel), however, was very minimal compared to FPIs and MFs.
- Other QIBs showed exit rates broadly comparable to MFs (~3.0% at 30 days, rising to ~14.5% at 90 days).
3.3.2 Absolute Value of Category-wise Exit
Figure 8 (bottom panel) presents the absolute value (₹ in crore) of anchor holdings sold at each exit stage by category, providing a measure of actual secondary market supply generated by anchor exits:
- FPIs dominated in absolute exit value across all three stages, contributing approximately ₹1,750 crore at First Exit (~3% of anchor allotment to FPIs), ₹4,800 crore (~9%) at 60-day mark, and ₹10,400 crore (~20%) at Second Exit. This confirms FPIs not only exit a higher percentage of their anchor holdings, but also generate the largest quantum of secondary market supply by a wide margin, given their larger allotment base.
- MFs were the second largest source by value: approximately ₹1,300 crore at First Exit (~3% of anchor allotment to MFs), ₹3,200 crore (~7%) at Exit-60D, and ₹6,800 crore (~15%) at Second Exit. While MF exit intensity (%) is lower than FPIs, their large allotment base still translates into significant absolute supply.
- The incremental step-up in exit value from First Exit to 60 days to Second Exit is consistent and large for both FPIs and MFs. Exit-60D values were roughly 2.5–2.7 times the First Exit values, and Second Exit values were roughly 2.1–2.2 times the Exit-60 values, confirming that the majority of anchor-driven market supply is released gradually over the full 90-day window.
- AIFs, Other QIBs, and Body Corporates contributed approximately ₹200–450 crore per stage, individually small relative to FPIs and MFs, but collectively adding to the total supply in the secondary market during the exit window.
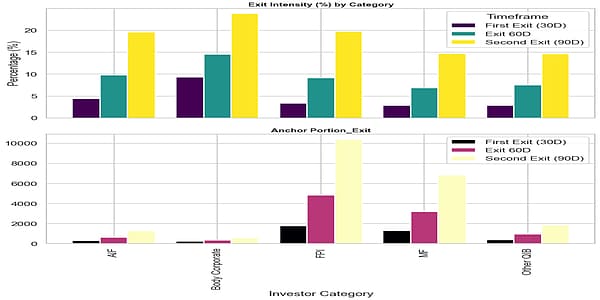
Figure 8: Category-wise Exit Summary (Value in ₹ Crore): Allotment Value and Value Exited at Each Stage
3.3.3 Density Distribution of Exit Percentages: FPI and MF
Figures 9 and 10 present kernel density estimates (KDE) and box plots of exit percentages for FPIs and MFs respectively at each of the three exit stages.
- FPI density chart (Figure 9): The KDE for First Exit is sharply peaked near 0-5%, but has a wider and heavier tail extending to 40-50% compared to MFs. The Second Exit KDE for FPIs flattens substantially and shifts rightward, with the interquartile range (from the box plot) spanning approximately 10% to 35% and median around 22% at 90 days. Several outlier ISINs showed FPI exit above 70-100%.
- MF density chart (Figure 10): The KDE is more sharply peaked near zero at all three stages, reflecting the higher zero-exit count for MFs. The First Exit box plot shows a median near zero with a very compressed IQR. Even the Second Exit box plot for MFs is notably more compact than the equivalent FPI box plot – MF IQR at 90 day exit spans approximately 2% to 20%, with median around 10%, which is substantially lower than the FPI equivalent.
- The direct comparison of the two box plots confirms the core finding: at every exit stage, FPI exit distribution have a higher median, wider IQR, and heavier upper tail than MF exit distribution.
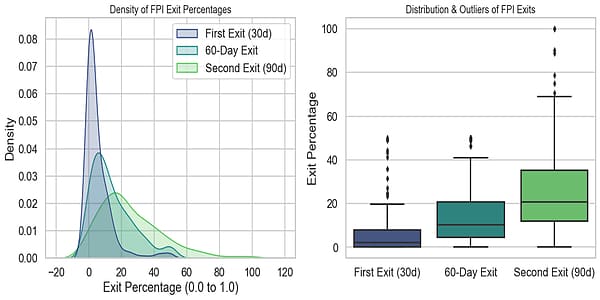
Figure 9: Density of FPI Exit Percentages
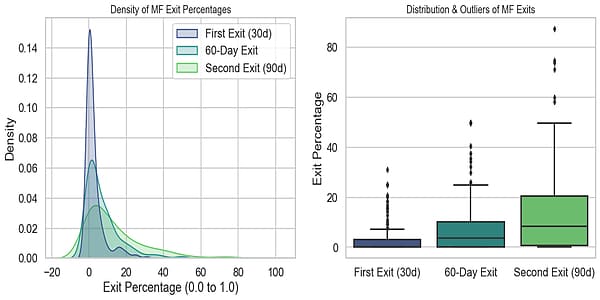
Figure 10: Density of MF Exit Percentages
3.3.4 FPI Exit Behaviour by Issue Size
Figure 11 presents FPI exit distribution across six issue size buckets at each exit stage, showing the count of IPOs in each exit intensity bucket (0%, >0–25%, >25–50%, >50–99%, 100%):
- In the ₹0–250 crore bucket, FPI behaviour is notably aggressive: at the 30-day mark, 18 of 33 IPOs fell in the >0–25% bucket and 5 in >25–50%, with only 10 showing zero exit. By 90 days, 16 IPOs were in >25–50%, 5 in >50–99%, and 1 at 100% exit.
- In mid-sized issues (₹501–1,000 crore and ₹1,001–2,500 crore), FPI exit was broadly in the >0-25% bucket (43 and 36 IPOs respectively at 30 days), with zero-exit counts of 25 and 13. By the 90-day stage, the distribution shifted substantially toward >25– 50% (27 and 39 IPOs respectively), confirming progressive and systematic FPI selling in these buckets.
- In the very large buckets (₹2,501–5,000 crore and >₹5,000 crore), FPI zero-exit counts are low (3 and 1 at 30 days), meaning that virtually all FPIs begin selling almost immediately after the first unlock, but the magnitude of exit stays in the >0–25% range, with no 100% exit instances. This suggests FPIs in large IPOs exit promptly but partially, consistent with gradual portfolio rebalancing.
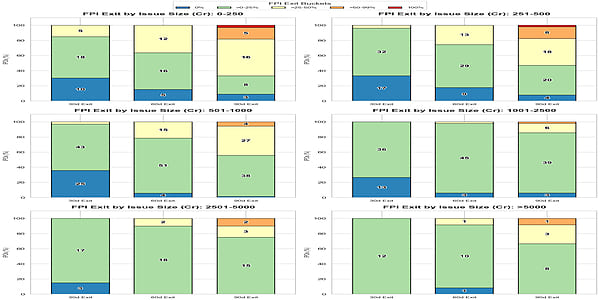
Figure 11: FPI Anchor Exit: Allotment and Weighted Exit Percentages by Issue Size Bucket
Note- Data labels inside the bars denote the count of IPOs
3.3.5 Mutual Fund Exit Behaviour by Issue Size
Figure 10 presents the equivalent analysis for Mutual Funds across six issue size buckets. Comparing directly with the FPI charts in Figure 9 reveals important behavioural differences:
- The most striking feature of MF behaviour is the very high zero-exit counts at the First Exit stage across virtually all size buckets. In the ₹0–250 crore bucket, all 3 IPOs with MF anchor participation showed zero MF exit at all three stages. MFs appear entirely absent from the selling side in this bucket.
- In the ₹251–500 crore bucket, MF zero-exit count at 30 days was 23 (vs. 17 for FPIs in the same bucket), and the proportion in higher exit buckets was smaller than that of FPIs.
- In the ₹501–1,000 crore bucket, 46 of 71 IPOs (65%) showed zero MF first exit, far exceeding the FPI zero-exit count of 25 of 70 (36%) for the same bucket.
- In larger buckets (₹2,501–5,000 crore and >₹5,000 crore), MF zero-exit at 30 days was 8 and 1 respectively, and the distribution was concentrated in the >0–25% range at all stages.
- No MF 100% exit was observed in any issue size bucket, in contrast to FPIs where a small number of 100% exit instances were observed in issues up to ₹500 crore. This reinforces the picture of MFs as more restrained sellers than FPIs.
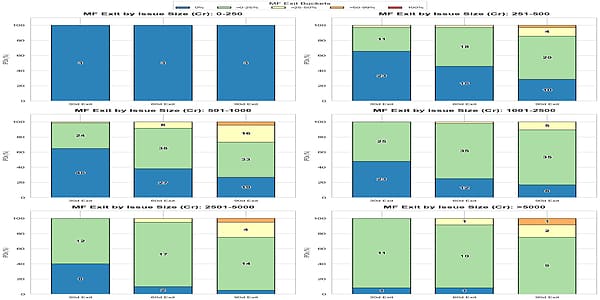
Figure 12: MF Anchor Exit: Allotment and Weighted Exit Percentages by Issue Size Bucket
Note- Data labels inside the bars denote the count of IPOs
3.4 Price Impact Analysis at Key Exit Windows
3.4.1 Exit Intensity and Price Impact: 30-Day Window
To test whether anchor selling intensity affects price performance during the unlock windows, IPOs were classified into exit intensity buckets at both the 30-day and 90-day stages using customized thresholds, and price changes during the corresponding unlock windows (T+29 to T+33 and T+89 to T+93) were analysed.
Figure 13 (bar charts) presents the average (mean) price impact at the 30-day and 90-day unlock windows by exit intensity bucket, and Figure 13 (box plots) presents the distributional view (median-based) of the same. The following observations are made:
- At the 30-day window, the mean and median price impact chart (Figure 13) show a broadly negative trend as exit intensity rises. The mean price impact during T+29 to T+33 rises from approximately −0.4% (exit up to 2.5%) to −1.3% (for 2.5-10% exit bucket) to −3.5% (for >10% bucket). The greater than 10% exit bucket is distinguishable from the lower exit buckets and has a median price impact of approximately −6% with the IQR predominantly in negative territory.
- At the 90-day window, all three buckets showed near-zero mean/ median price change, and the price impact is muted as compared to 30-day window.
- Taken together, these observations suggest that exit-driven price pressure is fairly noticeable at the 30-day unlock window, and is concentrated in the highest exit intensity bucket.
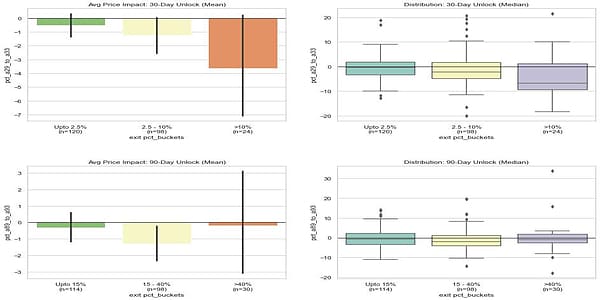
Figure 13: Price Impact by Customised Exit Intensity Buckets: 30-Day and 90-Day Unlock Windows
3.4.2 Investor Category-wise Exit Composition: 30-Day Window
Figure 14 presents a heat map of average exit percentage by investor category across the 30-day exit intensity buckets. In the critical greater than 10% exit bucket, FPI was the largest contributor at 24.5% average exit, followed by Body Corporate (23.1%) and Other QIB (21.6%).
MF showed only 11.5% average exit even in the highest exit intensity group, reinforcing the earlier observations that MFs are more patient holders.
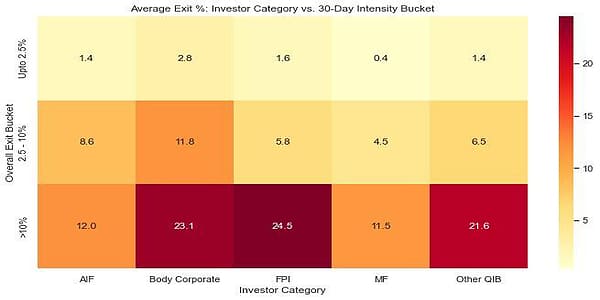
Figure 14: Average Exit % by Investor Category vs. 30-Day Exit Intensity Bucket
3.5 Exit Analysis – Extended Until 365 days from Allotment Date
3.5.1 Anchor Portion Exit Summary
Figure 17 extends the exit summary to all five measurement windows: First Exit (T+30), Exit-60d (T+60), Second Exit (T+90), Exit-180d (T+180), and Exit-365d (T+365), T being the allotment date. The four-panel chart presents overall exit summary (panel i), exit by ICDR Regulation (panel ii), an exit intensity heatmap by issue size bucket (panel iii), and cohort-year exit trends (panel iv).
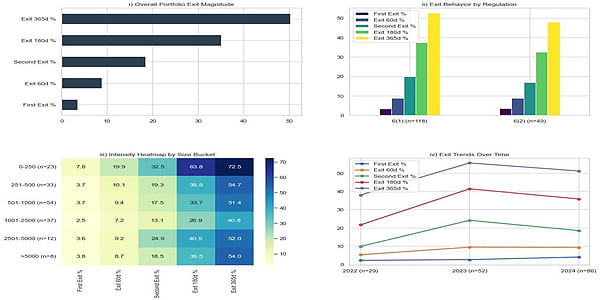
Figure 17: Exit Summary: Overall, by Regulation, by Bucket (Heatmap), and by Year (Extended to 365 Days)
The overall anchor portion exit summary (panel i) shows a clear exponential progression: aggregate weighted exit of the anchor portion rises from approximately 3.5% at T+30 to 9.3% by T+60, 18.5% by T+90, 34.4% by T+180, and 50.7% by T+365. By one year from allotment, approximately half of aggregate anchor allotment value has been disposed of across the anchor investors’ portfolio, indicating that the prescribed exit windows capture only a fraction of eventual anchor selling.
The intensity heat map (panel iii) reveals a persistent inverse relationship between issue size and exit rate: the 0–250 crore bucket recorded a 365-day exit of 72.5%, the highest of any size category, compared to 40.8% for the 1001–2500 crore bucket. The year-trend panel (panel iv) shows the 2023 cohort (n=52) recording the highest 365-day exit at approximately 55%, the 2022 cohort (n=29) the lowest at 37%, and the 2024 cohort (n=86) at 51%.
3.5.2 Distribution of Exit Percentages: By Issue Size
Figures 18 through 22 present box-and-strip plots of ISIN-level exit percentages across six issue size buckets (in Rs. crore) at each of the five measurement windows. The size-exit gradient (observed in the earlier analysis, refer section 3.2.2) is persistent and intensifies over time. By T+365 (Figure 22), the 0–250 crore bucket median exit was approximately 75% with IQR spanning 55–100%, while the largest-bucket IPOs show median T+365 exit of around 50%.
At each stage, a U-shape exit pattern is noticed across the issue size buckets, suggesting that exit by anchor investors usually decreases with issue size until a certain issue size (Rs. 10012500 bucket) and then increases with size thereafter (possibly to free up their capital locked in huge issues).
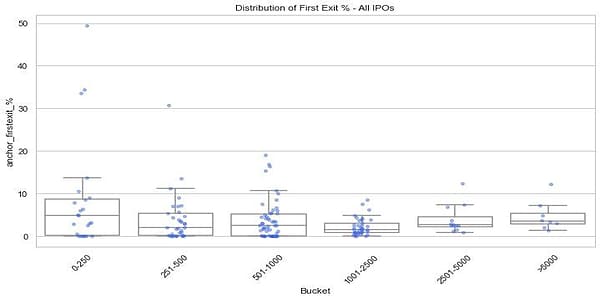
Figure 18: Distribution of First Exit % by Issue Size Bucket (All IPOs, n=167)
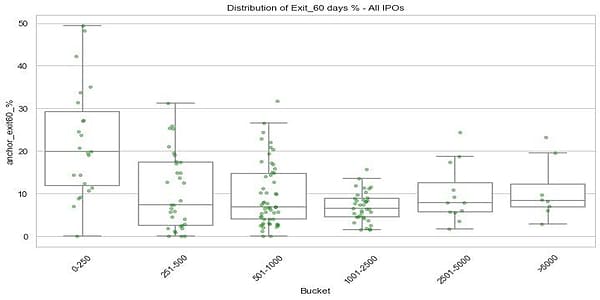
Figure 19: Distribution of Exit-60 Days % by Issue Size Bucket (All IPOs, n=167)
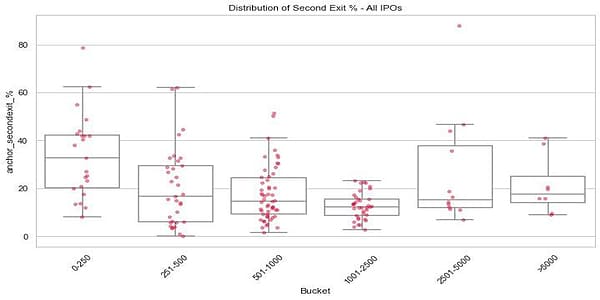
Figure 20: Distribution of Second Exit % by Issue Size Bucket (All IPOs, n=167)
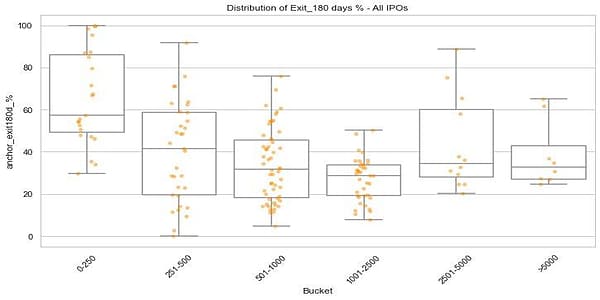
Figure 21: Distribution of 180-Day Exit % by Issue Size Bucket (All IPOs, n=167)
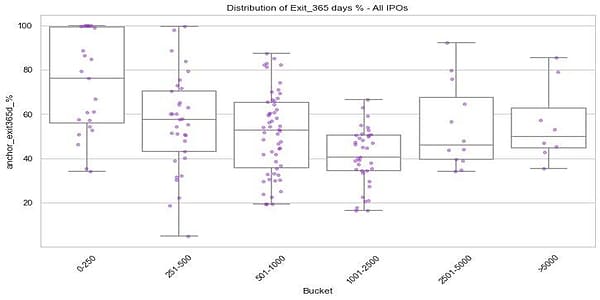
Figure 22: Distribution of 365-Day Exit % by Issue Size Bucket (All IPOs, n=167)
3.5.3 Classification of ISINs by Exit Intensity
Figure 23 extends the exit bucket classification to all five windows using the same five-band structure: zero exit (=0%), greater than 0% to 25%, greater than 25% to 50%, greater than 50% to 99%, and 100% exit. At T+30, 26 ISINs recorded zero exit, falling to 5 by T+60 and 1 by T+90. By T+365, no ISINs retained zero exit, and 7 ISINs (4%) reached 100% exit, while 85 ISINs (51%) crossed the 50% threshold. The progressive shift confirms that exit by anchor investors is a gradual phenomenon extending well beyond the stipulated lock-in requirements.
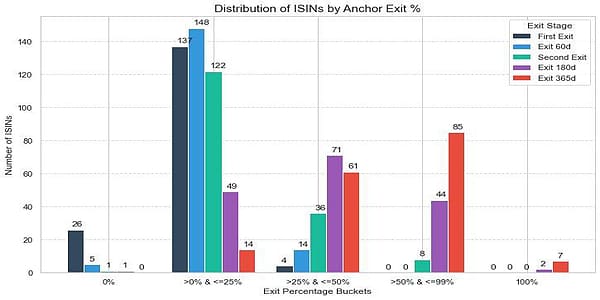
Figure 23: Distribution of ISINs by Anchor Exit %: All Five Windows (First Exit through 365-Day)
3.5.4 Category-wise Exit: Extended Window Analysis
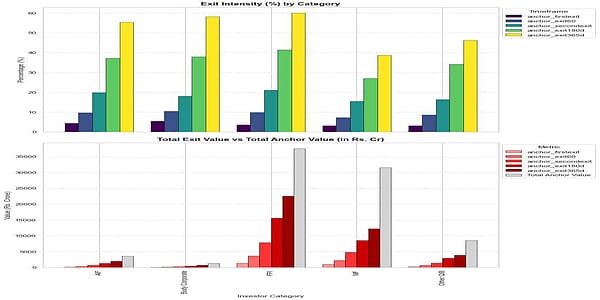
Figure 24: Category-wise Exit Value (₹ Crore) and Total Anchor Allotment Value: All Five Windows
Figure 24 extends the category-wise exit analysis to the 180-day and 365-day windows. Figure 24 (Top panel) reveals that by T+365, FPIs exited approximately 60% of their aggregate anchor allotment, the highest for any category. Body Corporates exited 58%, AIFs (55%), Other QIBs (46%), and MFs the lowest exit of 38%. The FPI-MF exit divergence visible at T+90 (FPI ~21% vs MF ~15%) widened substantially by T+365 (FPI ~60% vs MF ~38%).
Figure 24 (Bottom panel) contextualises the exit intensity in absolute value terms. FPIs dominated in absolute exit value (₹22,474 crore by T+365 against a total anchor allotment of ₹37,491 crore), followed by MFs (₹12,228 crore exit against ₹31,529 crore allotment). These figures confirm FPI dominance in both percentage and absolute market supply generated by anchor exit activity over the full year post-listing.
3.5.5 Density Distribution of Exit Percentages: FPI and MF Extended to 365 Days
Figure 26 (FPI density and distribution) shows that by T+365, the FPI exit distribution becomes bimodal: a cohort of IPOs with partial FPI exit (modal exit near 40-60%) and another cohort of IPOs with near-complete FPI exit (modal exit near 80-100%). This bimodality is absent at shorter horizons. The T+365 FPI box plot IQR spans approximately 50-90%.
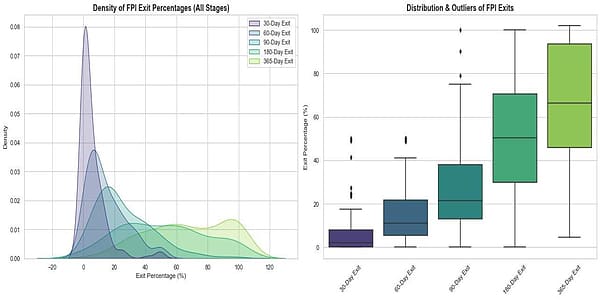
Figure 26: Density Distribution of FPI Exit Percentages: All Five Windows (30-Day through 365-Day)
Figure 27 (MF density and distribution) shows a different progression: the MF exit distribution broadens across windows but retains a single mode below 50% at all stages, showing that MFs exited less than 50% of their anchor allotment in majority of the IPOs by T+365. The T+365 MF median exit of approximately 35% is substantially below the FPI equivalent (~65%), and the T+365 MF IQR (~25–50%) is considerably narrower than that of FPI.
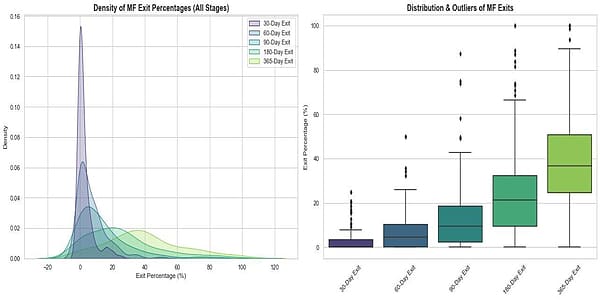
Figure 27: Density Distribution of MF Exit Percentages: All Five Windows (30-Day through 365-Day)
********
Notes:
1 The authors (in order) are officers of Securities and Exchange Board of India in the capacity of Deputy General Manager, and Manager in the Department of Economic and Policy Analysis. The authors sincerely acknowledge the valuable guidance and support received from Shri Sunil Kadam, former Executive Director SEBI; and Ms. Deepthi LS, Chief General Manager in the Department of Economic and Policy Analysis; and the Officials from Corporation Finance Department and Information Technology Department.
The findings and views in this paper are those of the authors and do not necessarily reflect the views of SEBI.
2 T stands for allotment date.
3 T stands for allotment date.