
PFRDA’s Pension Bulletin for April-June 2026 reviews India’s economy, pension-sector reforms, regulatory developments and NPS/APY performance. It notes improving industrial activity and developments across equity, debt, currency, commodity, interest-rate and inflation indicators. The Bulletin highlights the rapid expansion of retirement savings: as of March 2026, combined NPS and APY assets exceeded ₹16 lakh crore and the subscriber base crossed 9.6 crore, while APY recorded over 9 crore cumulative gross enrolments. PFRDA’s Chairperson discusses digitalisation through Aadhaar, UPI, Account Aggregator, eNPS and technology-driven supervision, alongside the challenge of balancing subscriber flexibility with retirement-income assurance. The Bulletin also covers NPS Vatsalya, NPS Sanchay for the informal workforce, Retirement Income Schemes and the broader “Pension for All” vision for 2047. Regulatory updates include the NPS Swasthya Pension Scheme under PFRDA’s Regulatory Sandbox and revised risk-based audit frameworks for Points of Presence handling NPS, NPS Vatsalya and APY.
Pension Fund Regulatory and Development Authority
Pension Bulletin
Section 1
Economy
Indian Economy
*The data used in this section has been taken from CMIE’s
Economic Outlook and MOSPI.
April- June 2026
The Indian economy in mid-2026 demonstrates robust macroeconomic stability, offering a constructive environment for long-term pension allocations. Guided by retail inflation cooling below median targets and steady industrial expansion, domestic fundamentals remain structurally sound. Significant tailwinds from global markets, specifically a sharp drop in crude oil prices, have reduced the import burden and strengthened the Rupee. Consequently, capital flows highlight diverging trends: foreign investors are accumulating Indian debt, while domestic institutions support recovering equities.
Equity Market
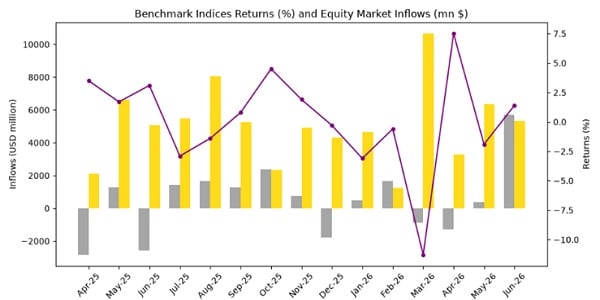
During June 2026, the domestic equity market exhibited a modest but encouraging partial recovery following the significant corrections observed in May. The benchmark Nifty 50 index recorded a positive monthly return of 1.4%, closing with a Price-to-Earnings (P/E) ratio of 20.6 times, indicating a stabilization in broader market valuations. Concurrently, the BSE Sensex outperformed slightly, registering a 2.3% gain with a comparable P/E ratio of 20.8 times. This upward trajectory suggests that investor sentiment has partially absorbed earlier macroeconomic shocks, finding support in stable corporate earnings expectations and favorable domestic inflation metrics. Despite persistent global uncertainties and foreign capital outflows from the equity segment, strong domestic equity mutual fund inflows provided crucial structural support. For pension portfolios, these prevailing valuation multiples present a balanced risk- reward profile, favoring defensive accumulation strategies steadily moving forward.
Institutional Investment
Institutional investment flows in June 2026 demonstrated a remarkable divergence between foreign and domestic participants, heavily influenced by shifting macroeconomic paradigms. Foreign Portfolio Investors (FPIs) recorded a net positive inflow of USD 531.4 million, but this masked a massive structural rotation. FPIs aggressively divested from Indian equities, pulling out USD 5,157.5 million, while simultaneously pumping USD 5,689.0 million into Indian debt instruments, signaling strong confidence in India’s fixed-income yields and sovereign stability. Conversely, domestic Mutual Funds exhibited opposite behavior, acting as the primary counterweight in the markets. Mutual funds reported a net overall outflow of USD 4,299.4 million. However, their equity segment saw robust net additions of USD 5,332.5 million, effectively absorbing the foreign equity sell-off. At the same time, mutual funds witnessed severe redemptions in their debt portfolios, amounting to outflows of USD 9,632.0 million. This structural tug-of-war highlights a domestic preference for equity market bargains following May’s dip, contrasted against foreign preference for high-yielding, stable Indian debt assets.
Currency Market
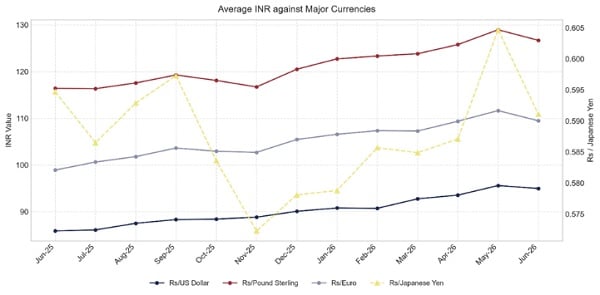
The Indian Rupee (INR) displayed robust strength across all major global currency pairings throughout June 2026, providing relief to import- heavy sectors and overall macroeconomic stability. Against the primary benchmark US Dollar (USD), the Rupee appreciated by 0.7%, improving from May’s average to settle at Rs. 94.97. This appreciation trend was even more pronounced against other major fiat currencies. The Rupee strengthened by 1.8% month-on- month against the Pound Sterling (GBP), reaching Rs. 126.70. Similarly, it gained 2.0% against the Euro (EUR) to close at Rs. 109.47 and recorded its highest relative gain of 2.3% against the Japanese Yen (JPY), averaging Rs. 0.5911 per 100 Yen. This broad-based currency appreciation is largely attributable to the massive influx of foreign portfolio investments into the Indian debt market, alongside a drastically lower domestic import bill driven by plunging international crude oil prices. A stronger Rupee subsequently helps insulate the domestic economy from imported inflation, thereby supporting overarching pension fund purchasing power and real returns.
Commodity Market
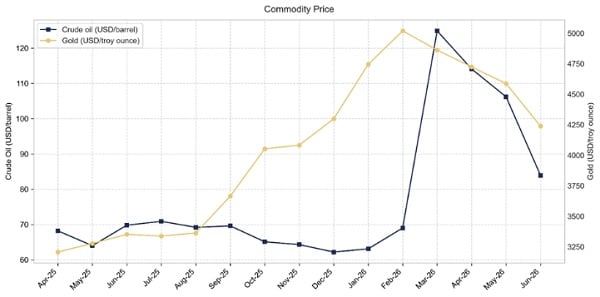
The global commodity markets experienced bearish pressures during June 2026, characterized by dramatic price contractions in both energy and precious metal sectors. The Indian Basket of Crude Oil registered a substantial decline of 19.6%, plummeting from USD 106.2 per barrel in May to average USD 83.9 per barrel. This sharp correction in energy costs serves as a vital macroeconomic tailwind for India, significantly reducing current account deficit pressures and directly suppressing operational costs across the manufacturing and logistics sectors. Simultaneously, traditional safe-haven assets faced intense liquidation. London Bullion gold prices fell by 7.6% to USD 4,238.3 per troy ounce, marking the sharpest single-month decline recorded since the 2008 financial crisis. This massive unwinding in gold suggests a shift in global risk appetite, as international investors rotated capital out of non- yielding precious metals and into sovereign debt markets. For pension funds, these suppressed commodity valuations reduce immediate inflation hedging requirements, allowing greater focus on traditional financial assets and structured fixed-income allocations.
Interest Rates
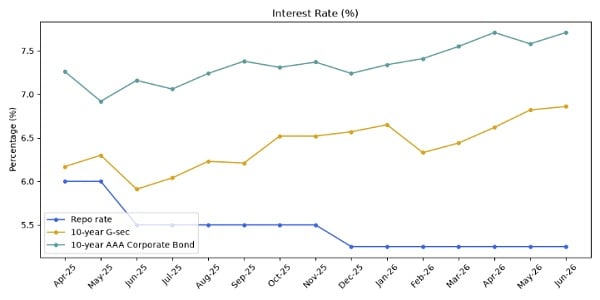
While specific benchmark rate alterations were muted in June 2026, the underlying interest rate environment was deeply shaped by favorable liquidity conditions and converging macroeconomic indicators. With headline retail inflation (CPI) cooling to 3.93%, falling comfortably below the central bank’s 4.0% median target, the monetary policy outlook has pivoted toward a decisively neutral -to- accommodative stance. This contained inflation, bolstered by a 19.6% crash in crude oil prices, eliminates near-term pressures for rate hikes. Consequently, the fixed-income market witnessed a massive surge in demand, evidenced by the USD 5,689.0 million influx of Foreign Portfolio Investment into domestic debt instruments. This robust foreign buying pressure on sovereign and corporate bonds naturally suppresses yield curve ascensions, ensuring borrowing costs remain stable for industrial expansion. However, massive domestic mutual fund debt redemptions of USD 9,632.0 million introduced localized liquidity tightening in shorter-duration corporate papers. For pension portfolios, the current interest rate plateau offers an optimal window to lock in elevated yields before anticipated future cuts.
Consumer Price Index (CPI)
Reflecting shifting macroeconomic currents, the CPI data for June 2026 indicates a moderate firming of price pressures, with combined year- on-year retail inflation accelerating to 4.38% from May’s 3.93%. This trajectory was predominantly driven by a climbing Consumer Food Price Index, which settled at 5.32%, alongside extraordinary commodity-specific surges in assets like silver jewellery, which skyrocketed by 133.21%, and ginger at 50.41%. Structurally, the inflationary burden skewed heavily toward rural demographics, which experienced a 4.74% general rate compared to a more subdued 3.92% in urban centers. Fortunately, steep deflationary relief in agricultural staples such as potatoes at – 20.34% and peas at -9.67% helped anchor the broader combined General Index, finalizing at exactly 107.00. From a regional perspective, southern states faced the highest pricing pressures, with Telangana leading the nation at a 6.36% inflation rate, followed by Andhra Pradesh at 5.39%.
Index of Industrial Production
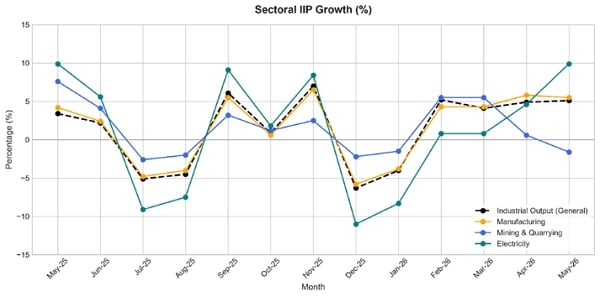
In May 2026, the Index of Industrial Production (IIP) registered a 5.1% year-on-year growth, with the Quick Estimate index reaching 122.7. The Ministry of Statistics and Programme Implementation (MoSPI) introduced a major methodological shift, replacing the Wholesale Price Index with the Output Producer Price Index as the deflator for value-based item groups. This impacts 234 item groups, comprising 36.02% of the total index weight. Sectoral performance demonstrated strong industrial expansion, led by Electricity and Gas Supply growing at 9.9% and Manufacturing advancing by 5.5%. Conversely, Mining and Quarrying contracted by 1.6%. Within manufacturing, production of electrical equipment surged by 20.8% and motor vehicles grew by 14.5%. The use-based classification further highlighted robust investment activity, heavily driven by a 12.9% expansion in Capital Goods and a 7.2% rise in Consumer Durables. Infrastructure, Intermediate Goods and Primary Goods also recorded steady positive growth rates during the month, firmly reinforcing broad- based industrial recovery.
Data Table
Economic Indicators
| Indicators | Jun-25 | May-26 | Jun-26 | YoY change (%/bps) |
|---|---|---|---|---|
| FPI Equity Investments (USD billion) | -2.594 | -3.450 | -5.158 | -98.8% |
| Rupees per dollar | 85.90 | 95.60 | 94.97 | 10.56% |
| Rupees per Pound Sterling* | 116.43 | 128.96 | 126.70 | 8.82% |
| Rupees per Euro* | 98.92 | 111.65 | 109.47 | 10.67% |
| Rupees per Japanese Yen* | 0.5947 | 0.6047 | 0.5911 | -0.61% |
| Crude Oil (USD/Barrel)* | 69.8 | 106.2 | 83.9 | 20.2% |
| Gold (USD/troy ounce)* | 3,352.0 | 4,587.5 | 4,238.3 | 26.4% |
| Weighted Average Call rate (%) | 5.39 | 5.24 | 5.32 | -7 bps |
| Market repo rate (%) | 5.50 | 5.25 | 5.25 | -25 bps |
| G sec 1-year (%) | 5.58 | 5.95 | 5.87 | 29 bps |
| G sec 10-year (%) | 5.91 | 6.82 | 6.86 | 95 bps |
| AAA rated corporate bond 10-year (%) | 7.16 | 7.58 | 7.71 | 55 bps |
| CPI Inflation (%) | 2.10% | 3.93% | 4.38% | 228 bps |
–
| Indicators | May-25 | Apr-26 | May-26 | YoY change (%/bps) |
|---|---|---|---|---|
| IIP# (%) | 3.40% | 4.90% | 5.10% | 170 bps |
* Monthly Average Rate.
#IIP figures presented under the May-25, April-26, and May-26 columns correspond to the data releases for the respective months as published by MoSPI. IIP figure for June 2026 have not yet been released by MoSPI.
Section 2
Management Speaks
“Pension Reforms in the Era of Digitalisation:
Balancing Flexibility and Assurance”
Chairperson, PFRDA’s speech at Symbiosis School of
Banking and Finance, Pune 1st June, 2026
Address by the Chairperson, Pension Fund Regulatory and Development Authority Good afternoon, distinguished faculty and the future business leaders of India.
It is a privilege to stand before a gathering of young minds who will, in ten to fifteen years, occupy roles — as entrepreneurs, executives, policymakers, investors and innovators — that will shape the economic and social compact of a nation. The subject I bring before you today is not a narrow regulatory matter. It is, at its heart, a story about the intersection of demography, technology, finance and the state’s obligation to its citizens in their most vulnerable years. India’s pension sector stands at a transformative inflection point — one where the accelerating forces of digitalisation are reshaping the architecture of retirement security with a speed and breadth unprecedented in the system’s twenty-year history. This address examines what that transformation means, what it can achieve, what it cannot and what the regulatory architecture must ensure so that the speed of technology does not outpace the deliberateness of protection.
The Numbers That Define the Moment
Let me begin with the data — because in policy, numbers are not mere statistics; they are moral claims.
As of March 2026, the combined Assets Under Management (AUM) of the National Pension System (NPS) and the Atal Pension Yojana (APY) stood at over ₹16 lakh crore—a near four-fold increase from ₹4.17 lakh crore six years earlier. During the same period, the combined subscriber base across NPS and APY crossed 9.6 crore. Separately, the Atal Pension Yojana (APY) has recorded over 9 crore cumulative gross enrolments, including 1.35 crore new gross enrolments during FY 2025–26, the highest annual enrolment since the scheme’s inception. NPS equity funds have delivered over 13% returns for Tier I accounts over a ten-year rolling period, while debt categories have returned over 8% annually, consistently outperforming comparable mutual fund categories.
These are achievements that deserve recognition. But they must be placed alongside an uncomfortable arithmetic.
India’s pension assets constitute roughly 17% of GDP — starkly below the OECD average, which consistently exceeds 80%. Ninety-three percent of India’s workforce, engaged in the informal economy, lacks statutory social security. By 2050, India’s population above 60 years will have doubled to over 300 million. Only 5.7% of Indian household financial savings are currently allocated to provident and pension funds.
The demographic dividend that has powered India’s economic ascent will, within a generation, become a demographic obligation. This is the context in which digitalisation presents itself — not merely as a tool of efficiency, but as a structural enabler of an ambition that the nation’s development trajectory now demands.
The Architecture of Reform: Two Decades in Perspective
The DC Turn of 2004, For you as MBA students, understanding any business or policy system requires understanding its founding architecture. India’s pension reform began in January 2004, when the transition from an unfunded defined-benefit system to a funded defined-contribution system was initiated for central government employees. The old pension scheme — generous by design, opaque in liability and incrementally fiscally unsustainable — was replaced by a system in which individual retirement outcomes would be determined by contributions, investment returns and annuity choices, rather than a guaranteed fraction of last- drawn salary.
This transition was not without controversy and its echoes persist. The sustained demand from government employees for a return to defined- benefit assurance reveals a fundamental tension that no pension design can fully dissolve — the tension between the desire for assured income regardless of market performance and the reality of fiscal sustainability. This is the central design challenge we will keep returning to.
The Unified Pension Scheme: A Hybrid Innovation
The Unified Pension Scheme, implemented from April 1, 2025, represents perhaps the most thoughtful navigation of this tension yet. Central government employees with at least 25 years of service are entitled to an assured pension of 50% of average basic pay — a defined-benefit guarantee layered upon a defined-contribution chassis. This is, in the language of retirement finance, a “floor- with-upside” design. The DC chassis ensures fiscal sustainability and investment discipline; the DB floor ensures that subscribers receive a minimum assured pension even if markets underperform.
PFRDA’s Dual Mandate
Unlike pure-play prudential regulators whose primary obligation is system stability, PFRDA carries an affirmative statutory mandate under Section 14 of the PFRDA Act, 2013 — to “promote old age income security.” This developmental dimension is not peripheral to our identity; it defines it. It means we are simultaneously building markets, regulating them and protecting subscribers who may lack the financial literacy to protect themselves.
Digitalisation as Structural Enabler
India’s Digital Stack: A Global Differentiator
India possesses, in its Digital Public Infrastructure, a competitive advantage for pension system transformation that no comparable developing economy can match. Consider each layer.
Aadhaar has fundamentally altered onboarding economics. The KYC cost for a new NPS subscriber has been reduced to a fraction of its former level through Aadhaar based eKYC — making it economically viable to onboard and service subscribers with modest corpus sizes, including informal sector workers.
UPI has transformed contribution collection. The ability to make NPS contributions through any UPI-enabled interface has eliminated the historical friction of bank transfers and physical payments. For the gig economy worker, UPI-enabled NPS contributions represent the difference between practical participation and theoretical availability.
The Account Aggregator (AA) framework holds perhaps the most transformative long-term potential. By enabling consent-based sharing of financial data across institutions, AA creates the technical foundation for personalised pension advice, automated contribution optimisation and ultimately a “pension intelligence layer” that adapts investment strategy and withdrawal sequencing to the subscriber’s complete financial picture.
eNPS and the Digital Onboarding Revolution
The eNPS platform has evolved from a supplementary channel to the primary mode of subscriber onboarding. Aadhaar-based eKYC now enables account creation within minutes. Video- based Customer Identification Processes (V-CIP) extend digital onboarding to subscribers who may lack Aadhaar biometric authentication. The extension of eNPS integration to the BSE STAR MF platform — which connects thousands of mutual fund distributors across India — gives NPS access to a distribution network that has already established trusted relationships with retail financial savers.
TRACE: Supervision for the Digital Age
The TRACE platform represents the application of supervisory technology (SupTech) to pension regulation. Traditional supervision has been predominantly backward-looking — inspections and audits examining past conduct. TRACE enables continuous, data-driven surveillance of pension fund behaviour, contribution flows and subscriber account activity, creating the conditions for prospective and risk proportionate supervision. PFRDA is also developing an AI -Enabled Grievance Redressal System — using natural language processing to triage subscriber complaints and identify systemic patterns in grievance data that may signal emerging regulatory issues.
Product Innovation: Expanding the Frontier of Retirement Choice
Personalisation at Scale
For most of NPS’s existence, the system operated on a one-size-fits-all product philosophy — a standardised investment menu with three asset classes and a binary choice between Active and Lifecycle options. This standardisation served the establishment phase well. But it increasingly constrained the system’s ability to serve a subscriber base ranging from 18-year-old gig economy workers to 58-yearold senior civil servants. The Multiple Schemes Framework (MSF), launched at NPS Diwas 2025, changes this fundamentally. All ten registered Pension Funds have launched differentiated schemes targeting specific subscriber segments — professionals, entrepreneurs, corporate employees, women and platform workers — with investment mandates calibrated to the specific risk-return requirements and income patterns of each segment. Competition on product design, not just returns, gives Pension Funds an incentive to invest in subscriber research — activities that, over time, should improve the alignment between product design and subscriber needs.
NPS Vatsalya: The Intergenerational Pension Compact
NPS Vatsalya, introduced in 2024, enables parents to initiate pension savings for minor children — creating the possibility of a contribution period spanning from childhood through retirement, potentially fifty years or more. The financial mathematics are compelling: at a 9% annual return, a ₹1,000 monthly contribution begun at age 10 generates over ₹1.5 crore by age 60, compared to approximately ₹35 lakh for the same contribution begun at age 30. But the significance of NPS Vatsalya is not primarily arithmetical. It represents a shift in the cultural and institutional framing of pension savings — from an obligation incurred at employment to a lifelong habit initiated in childhood. The Pension Sakhi initiative, which trains women as grassroots pension ambassadors in rural communities, creates the social infrastructure through which this intergenerational compact can be transmitted.
NPS Sanchay: Bridging the Formal-Informal Divide
Introduced in May 2026, NPS Sanchay is a simplified NPS variant specifically designed for India’s vast informal workforce. Its design features directly address the mismatch between a system originally designed for salaried workers with regular monthly income and the reality of irregular, often daily-wage income flows in the informal economy.
The NABARD MoU — aiming to reach approximately 10 crore farmer members through 45,000 Farmer Producer Organisations — provides NPS Sanchay with a distribution infrastructure of extraordinary reach. The Zomato pilot, which brought over 60,000 platform workers into NPS through digital onboarding integrated within the app, demonstrates the potential of embedding pension access within the digital interfaces that gig workers already use for their primary economic activity. Similar integrations with Swiggy, Ola and Urban Company could bring several million additional platform workers into the formal pension system within a five-year horizon.
The Decumulation Revolution: Retirement Income Schemes
For the first twenty years of NPS’s existence, design energy was concentrated overwhelmingly on the accumulation phase. The exit architecture — how subscribers convert their accumulated corpus into retirement income — remained underdeveloped. As the NPS subscriber base matures and the first cohort of All Citizen NPS subscribers approaches retirement, the decumulation question has moved from theoretical to urgent. The Retirement Income Schemes (RIS) and structured Drawdown Options, introduced through PFRDA Circular dated May 15, 2026, are the regulatory culmination of an extensive consultation process. Under the RIS framework, subscribers can select phased withdrawal of their designated pension corpus through different drawdown options, with the remaining corpus continuing to generate returns through the RIS lifecycle fund. The RIS Steady variant employs a continuously declining annual glide path that reduces equity exposure from 35% at age 60 to a floor of 10% at age 75, held constant thereafter until age 85 — optimising periodic payouts while managing the risk of premature have no impact on the mandatory annuitisation requirement. This design preserves the statutory lifelong pension guarantee while adding flexibility around the remainder — the floor-with-upside principle applied to the decumulation phase. corpus exhaustion. Critically, withdrawals under the RIS mechanism have no impact on the mandatory annuitisation requirement. This design preserves the statutory lifelong pension guarantee while adding flexibility around the remainder — the floor-with-upside principle applied to the decumulation phase.
The Regulatory Sandbox: Innovating with Intelligence
PFRDA’s Regulatory Sandbox Framework provides a structured mechanism for time-limited, controlled experimentation with innovative products and processes. The NPS Swasthya Pension Scheme, launched as Proof of Concept 1, is India’s first experiment integrating health-related benefit mechanisms into a pension architecture — allowing subscribers access to health benefits linked to their NPS corpus without compromising its primary retirement income purpose. PoC 2, effective April 7, 2026, was launched with modified features — including mandatory health insurance integration under IRDAI-governed terms and a more granular disclosure framework. The iterative design of the Sandbox is itself instructive. Evidence gathered in PoC 1 informed the calibrations of PoC 2 — this is what evidence-based regulation looks like in practice.
The Core Design Challenge: Flexibility vs. Assurance
Understanding the Tension Allow me to now turn to the most intellectually demanding dimension of this subject — one that I believe you as MBA students are particularly well-equipped to appreciate.
Flexibility, in the pension context, encompasses multiple dimensions: flexibility in contributions (amount, timing, frequency), in investment choice (asset allocation, fund manager, risk profile), in withdrawal timing and in the structure of retirement income (lump sum, annuity, drawdown, or combination). Each dimension serves a genuine subscriber need.
Assurance is the counterweight — the guarantee that retirement savings will actually be available as retirement income, rather than being depleted through excessive withdrawals, consumed by fees, eroded by poor investment decisions, or lost to fraud and mismanagement. Assurance is what distinguishes a pension system from a general savings account. It is the quality that commands public trust, without which voluntary pension saving cannot achieve scale.
The regulatory design challenge is to provide sufficient flexibility to accommodate the genuine heterogeneity of subscriber circumstances without compromising the assurance that gives the system its social purpose. This is not a mathematical optimisation problem. It is a design challenge requiring continuous calibration as subscriber demographics, economic conditions and behavioural evidence evolve.
The Behavioural Economics Dimension
I want to introduce a dimension that business schools understand well — the behavioural economics of savings decisions. The international evidence on pension participation is unambiguous: opt-out systems dramatically outperform opt-in systems in enrolment rates. India has historically relied on opt-in participation for NPS All Citizen and APY. The move toward opt-out defaults — beginning with the formal sector and progressively extending to the gig economy — would be the single most powerful lever available to expand enrolment without coercive mandates. Auto- contribution integration with platform payment flows is the gig economy’s version of the payroll deduction. Its implementation at scale could add tens of millions of subscribers within a five-year horizon. The Zomato pilot is the proof of concept. The next step is to make auto-contribution the default rather than the exception.
The Coverage Challenge: India’s Unfinished Agenda Approximately 450 million working Indians lack any form of statutory retirement income protection. While the Atal Pension Yojana (APY) has recorded over 9 crore cumulative gross enrolments since its launch, it currently provides pension coverage to over 6.6 crore informal sector subscribers. This represents a significant milestone in extending social security to underserved workers. However, against an estimated target universe of 45 crore unprotected ratio remains approximately 15%. While the progress achieved is substantial, it also underscores the considerable scope for expanding pension coverage in the years ahead.
The informal sector’s distinct barriers operate at three levels:
Demand level: Income uncertainty makes fixed monthly contributions structurally impossible for many workers. NPS Sanchay’s accommodation of small, irregular payments directly addresses this.
Supply level: The unit economics of servicing accounts with average monthly contributions of ₹200–500 do not support the commission structures of formal financial intermediaries. The Pension Agent model creates a new category of lastmile distributor.
Trust level: Historical financial exclusion creates rational scepticism toward formal institutions. Peer networks, women Self-Help Groups and FPO ambassadors are more credible messengers than urban institutional channels.
The platform economy offers a distinctive opportunity. Platform workers are digitally connected, their income is received digitally and their transactions are documented with a granularity that most formal payroll systems cannot match. The challenge is building auto- contribution integration with platform payment flows — so that a defined percentage of each platform payment is automatically routed to the worker’s NPS account, transforming the behavioural economics of pension saving from opt-in to opt-out.
Governance Modernisation for the Digital Age
The reconstitution of the NPS Trust Board in January 2026 — with Dinesh Kumar Khara, former Chairman of State Bank of India, as Trust Chairperson — brings deeper banking system expertise to the oversight of a ₹15.5 lakh crore system. The appointment of Dr. Arvind Gupta, Co- Founder of the Digital India Foundation, as Trustee signals the Trust’s recognition that governance in the digital age requires trustees who understand technology architecture and data governance — not merely those versed in traditional financial oversight. The Board’s approval of a framework allowing Scheduled Commercial Banks to independently sponsor Pension Funds represents the most significant structural change in the pension fund management market since NPS’s inception. This will deepen competition, encourage product innovation and potentially bring NPS closer to the existing banking relationships of millions of middle- income subscribers. The revised Investment Management Fee structure, effective April 1, 2026, introduces a slab-based, differentiated rate regime — bringing NPS fee architecture into closer alignment with international benchmarks, where larger pension fund managers charge lower percentage fees on larger assets under management.
The Vision for 2047: From 9.64 Crore to Universal Coverage
India’s Financial Inclusion policy has enshrined the vision of “Pension for All” by 2047 as a national objective. Achieving this requires the simultaneous activation of three channels that have historically operated in isolation. The formal sector channel — ensuring every employer covered under the Code on Social Security, 2020 has operationalised NPS and that EPFO’s 7+ crore active members have genuine portability into NPS as a competitive alternative. The gig and platform economy channel — building on the NPS e-Shramik Model, a regulatory requirement that every digital platform operating in India contributes a minimum pension amount for each active platform worker, integrated directly into payment architecture. The deep informal sector channel — extending NPS Sanchay through the NABARD– FPO–MSME network into the 450 million unprotected workers who have no digital footprint today.
The Intelligent Pension System The pension systems of 2047 will not look like those of 2026. The most consequential transformation will be the emergence of AI-enabled, subscriber-facing architecture — where machine learning, behavioural data and real-time financial information combine to make pension saving a dynamically personalised, continuously optimised experience rather than a set -and-forget administrative obligation. The Account Aggregator framework creates the data substrate for personalised pension advice. A subscriber who grants consent to share banking transaction history, insurance coverage, EPF balance and NPS account data could receive genuinely useful guidance calibrated to their income pattern, existing coverage, family structure and retirement horizon. For subscriber communication and grievance management, natural language AI accessible via voice in all scheduled languages will eliminate the linguistic and literacy barriers that currently prevent many informal sector subscribers from engaging with their pension accounts. A migrant construction worker in Maharashtra whose home language is Odia should be able to check his NPS balance and make a contribution by speaking into a basic mobile phone.
What This Means for You You
are the generation that will design, build, manage and use these systems. Let me leave you with three propositions: First, pension reform is product design. The failures of pension systems globally are rarely failures of intent — they are failures of design. Products that are too complex, too inflexible, or too costly to access at the base of the economic pyramid remain theoretical assets for those who need them most. The MSF, NPS Sanchay and the RIS framework are not regulatory exercises — they are product design challenges of the highest order. Second, distribution is destiny. The best pension product that nobody joins changes nothing. The NABARD partnership, the Zomato pilot and the Pension Sakhi programme are distribution innovation — finding trusted intermediaries who can carry financial products to populations that formal institutions have historically failed to reach. For those of you going into financial services, consumer goods, or technology, the distribution question is always the hard question.
Third, trust is the ultimate currency. Every element of regulatory design — disclosure requirements, grievance redress, supervisory oversight, fiduciary governance — exists ultimately to create and preserve subscriber trust. A pension system that subscribers do not trust will not be used, regardless of how welldesigned its products are. The compounding effect of trust, like the compounding effect of returns, is invisible in the short term and decisive in the long term.
Closing
India has a narrow but consequential window to achieve universal pension coverage by 2047 — a window that technology can open, but only sound regulation can keep open. The journey from 9.64 crore subscribers to universal coverage is not a linear extrapolation of past trends. It requires genuine innovation — in product design, distribution economics, regulatory architecture and the behavioural framing of retirement savings as a lifelong commitment rather than a late-career obligation. You — the business leaders, technologists, policymakers and investors being formed in institutions like this — will decide whether India uses the digital moment to build the most inclusive pension system in the world, or allows the moment to pass while hundreds of millions of workers age without security.
The stakes are that high. And the opportunity is that real.
Thank you.
Section 3
Articles
Seeing Savings Differently: Delboeuf Illusion, Gamification and Gig workers
By Prodeepto Chatterjee, Deputy General
Manager, PFRDA Originally published in Hindi
in Sanchayita 2nd Edition 2025.

Figure- Which Dark Circle is bigger?
Look at the picture above and answer the following. In the figure, which set has the bigger dark circle, the left one encircled by a small circle or the right one with a larger circle? Funny as it may sound, the real answer is- the dark circle is same in size in both the settings. Welcome to the world of Delboeuf Illusion!
Delboeuf Illusion
The Delboeuf illusion, named after its first identifier the Belgian philosopher and mathematician Joseph Delboeuf, is a well- studied optical illusion that highlights how context and framing affects size perception. When the ring is close and only slightly larger, the central circle appears bigger; when it’s far and much larger, the central circle seems smaller. The illusion operates primarily through two key psychological principles, Assimilation Effect and Contrast effect. The ring close to the black disk makes it look larger than its actual size (assimilation). Similarly, the larger circumference of the outer ring dwarfs the central disc, causing it to be perceived as diminished in size (contrast).
This concept extends far beyond simple visual puzzles. It’s a well-studied optical illusion with profound implications in various fields, including psychology, art and notably, behavioural economics and product design. Visual framing, whether intentional or not, can powerfully influence our perceptions and, consequently, our decision-making.
Think about everyday scenarios. Empirical studies have shown that even something as mundane as the design of serving ware can affect how much food we serve ourselves. For instance, people tend to overestimate food portion size when it’s presented on plates with wider or coloured rims.
This isn’t just theory; many of us unknowingly participate in these experiments at our local restaurants. Ever noticed how buffet plates are often smaller than à la carte plates? This intentional design choice serves a clear business objective: owners want you to consume less food at a fixed buffet price (less cost for them!) and more when you’re paying per dish à la carte (more sales, fatter bills, more profit!).
Conversely, a particularly compelling application demonstrates a “less is more” paradox: when a food portion is depicted in a smaller container, it creates the illusion of a larger portion. This visual manipulation may lead participants to decrease their actual serving size. Similarly, a high color contrast between the food and the plate has been shown to result in individuals serving themselves less.

Leveraging the Delboeuf Illusion for Financial Perception
While the Delboeuf illusion has been traditionally studied in the context of physical quantities like food portions, its underlying principles of visual bias can be extended to influence the perception of abstract financial quantities and decision-making.
The challenge lies in translating an illusion based on the physical size of discs and plates to the abstract concepts of money, savings and debt. However, the common thread is the perception of quantity. If the Delboeuf illusion can make a physical quantity appear larger or smaller, it can potentially be adapted to make a numerical quantity—such as a small savings contribution— feel larger and more significant, or a substantial debt feel smaller and more manageable. Cognitive biases, which represent systematic approaches to framing information, profoundly shape judgment and decision-making in matters of savings and spending. The “picture superiority effect” i.e. information presented visually is more memorable and impactful than information presented as text, provides a crucial link, suggesting that the visual framing of financial data can indeed influence cognitive processing and, consequently, motivation towards financial goals.
So, the question we must ask is: Can we use these learnings to aid the financial savings of a rapidly growing segment of our workforce—the gig workers?
A promising approach is to integrate the concept of the Delboeuf Illusion with the gamification of the savings process.
The Gig-Worker Landscape and Their Financial Challenges
The sheer scale and projected trajectory of the gig economy underscore its emergence as a critical pillar of India’s extant labour market. Projections indicate a substantial increase in this workforce, projecting a workforce of 23.5 million by 2029-30. This remarkable growth is propelled by several interconnected factors- widespread technological advancements and proliferation of digital platforms which aid and promote freelance and contract work, evolving workforce preferences of flexible work arrangements over traditional employment and the economic necessity to seek additional income. Furthermore, businesses themselves contribute to this expansion by leveraging gig workers for cost efficiency, workforce flexibility and a healthy bottom line.
Despite the dynamic growth of the gig economy, its participants in India confront significant and persistent financial challenges. A primary concern is the inherent income uncertainty, which stems from the nature of the work (task- based engagement), inconsistent work availability and fluctuating wage policies dictated by platforms. A profound consequence of this income unpredictability is widespread financial exclusion from credit, banking services, savings and eventually access to social security benefits like health insurance, paid leave or pension schemes. This financial exclusion extends beyond individual hardship, impacting families and communities by perpetuating cycles of poverty and financial instability.
Gamification- What is it?
Gamification, coined by Nick Pelling in 2002, is formally defined as the strategic application of game design principles, mechanics and elements into non-game environments. Its core purpose is to address real-world problems, enhance user engagement and motivate individuals to achieve their objectives. The interdisciplinary foundations, spanning fields such as education, business, marketing and services, highlight that gamification is a scientifically informed methodology aimed at influencing human behaviour and fostering habit change.
The application of gamification in financial management has demonstrated a range of significant benefits like increased user engagement & retention, improved financial literacy, enhanced decision-making skills & behavioural modification and financial goal setting & progress tracking. Gamified applications can systematically shape and sustain positive financial habits, acting as a “financial behaviour architect” that designs environments to naturally encourage desired actions, rather than relying solely on willpower or abstract financial education. This is particularly potent for populations like gig workers who often face systemic barriers to achieving financial health.
Integrating Gamification with Delboeuf – Inspired Visuals
The Delboeuf illusion taps into the brain’s reliance on relative perception, making savings feel more rewarding and attainable when presented in smaller, fuller contexts. The “small plate” effect can nudge gig workers to prioritize saving overspending, leveraging a simple yet powerful visual bias. For gig workers, who often make small, frequent savings contributions due to irregular income, the “small numbers problem” can be a significant demotivator. When a small, saved amount (analogous to the inner disc) is presented visually surrounded by a slightly larger, closely placed “goal” circle (the outer ring), the actual small contribution can be perceptually overestimated due to the assimilation effect. This visual amplification makes incremental progress feel more substantial and rewarding, directly counteracting the psychological demotivation that often arises from seeing only small absolute numerical values.
Furthermore, savings progress bars can be designed to subtly leverage this illusion. For instance, a small, filled portion of a progress bar could be framed by a slightly larger, close “next milestone” indicator. This design would make the current progress appear more significant than its numerical value alone might suggest, directly applying the “less is more” paradox observed in food portioning studies. This manipulation of perceived momentum is crucial for driving actual financial behaviour, transforming the feeling of “too little to matter” into a sense of meaningful progress.
Conversely, for large and daunting debts, the Delboeuf illusion can be employed to reduce their perceived magnitude. By presenting the debt amount (inner circle) surrounded by a much larger, distant “total financial picture” or “original debt” circle (outer ring), the contrast effect could make the debt appear smaller and less overwhelming. This perceptual shift can reduce financial stress and enhance a gig worker’s sense of agency over their financial situation, encouraging consistent repayment efforts.
The true power emerges when the perceptual nudges of the Delboeuf illusion are seamlessly integrated with the motivational frameworks of gamification. This combination can transform abstract financial numbers into a more engaging, emotionally resonant and tangible experience.
| Idea | Concept | Application | Example |
|---|---|---|---|
| Visualizing Savings Goals with “Smaller Plates” | Presenting savings in a compact format can make the amount saved feel more significant. | Savings Apps or Dashboards | A savings app could show the Rs.200 savings as a nearly full small circle (perceived as “almost done”) rather than a partially filled large circle (perceived as “barely started”). |
| Contrasting Spending vs. Savings | The Delboeuf illusion’s contrast effect (a circle appears smaller when surrounded by a larger ring) can be used to make spending seem less appealing compared to savings. | Budget Visuals | A budgeting app might display Rs.50 spent on dining out in a large, hollow ring (seems insignificant) and Rs.50 saved in a small, filled ring (seems substantial), nudging users to prioritize saving. |
| Reframing Savings Contributions | The assimilation effect can make small savings contributions feel more impactful when presented in a context that emphasizes their relative size. | Micro-Savings Programs | A bank app could show daily Re.1 savings in a small, colorful circle that fills up weekly, making the Rs.7/week feel like a meaningful achievement. |
| Gamifying Savings with Visual Cues | The Delboeuf illusion can enhance gamification by making savings milestones appear more attainable, encouraging continued engagement. | Progress Bars | A savings challenge app could show a Rs.10 weekly savings goal as a small, nearly full ring, making users feel accomplished and motivated to continue. |
By making financial progress not just numerical but also visually and emotionally rewarding, this integrated approach shifts savings from a perceived chore to an engaging game. The combination of Delboeuf perceptual manipulation and gamification’s immediate, visceral rewards can transform financial saving and management into a more tangible and motivating experience for the gig workers.
References and further reading
1. https://fs.blog/why-you-eat-too-much- the-delboeuf-illusion/
2. https://www.linkedin.com/pulse/3- gamified-finance-indias-fintechs-turn- money-play-anuradha-aggrawal-o0stc
3. https://www.business- standard.com/finance/personal- finance/hdfc-bank-announces-giga- financial-product-for-india-s-gig- workers-124083000549_1.html
4. https://www.linkedin.com/posts/rajba nerjee10_gigeconomy-gamification- futureofwork-activity- 7236651409763401729-p9Zj
5. https://fortunly.com/news/fintech/mo bile-app-provides-finance-services-for- gig-workers/
6. https://www.foodnavigator- usa.com/Article/2012/01/18/The- Delboeuf-illusion-Why-expanding- dinner-plates-are-expanding-our- waistlines/
7. https://www.bankrate.com/personal- finance/best-finance-apps-for-gig- workers/
8. Behl, A., Sheorey, P., Jain, K., Chavan, M., Jajodia, I., & Zhang, Z. (2021). Gamifying the gig: transitioning the dark side to bright side of online engagement. Research on User Involvement, 25. https://pdfs.semanticscholar.org/3f89/ a376a8fd377d71a12072d218702277d116e b.pdf 1
9. Khurana, A. (2025, April 12). Better lives, bigger impact: How fintech is transforming the gig economy. Startup Success Stories India. https://startupsuccessstories.in/better- lives-bigger-impact-how-fintech-is- transforming-the-gig-economy/ 2
10. Van Ittersum, K., & Wansink, B. (2012). The Delboeuf illusion’s bias on serving and eating behavior. Journal of Consumer Research, 39 (2), 215 -228. https://academic.oup.com/jcr/article/3 9/2/215/1795747 7
11. Aggrawal, A. (2024, May 24). #3: Gamified finance: India’s fintechs turn money management into play. LinkedIn Pulse. https://www.linkedin.com/pulse/3- gamified-finance-indias-fintechs-turn- money-play-anuradha-aggrawal-o0stc 9
12. Banerjee, R.K. (2024, September 3). Gamification in gig economy, the hidden driving force. LinkedIn Pulse. https://www.linkedin.com/posts/rajba nerjee10_gigeconomy-gamification- futureofwork-activity- 7236651409763401729-p9Zj 10
13. Merisis Wealth. (n.d.). The intersection of fintech and the gig economy. Merisis Wealth Blog. https://www.merisiswealth.com/blog/ the-intersection-of-fintech-and-the-gig- economy 11
14. Plotline. (2024, December 2). Gamification in fintech apps: Top 5 examples. Plotline Blog. https://www.plotline.so/blog/fintech- app-gamification-examples 12
15. Economic Times. (2024, May 18). Online platforms take to gamification to boost user engagement. Economic Times Tech. https://economictimes.com/tech/techn ology/online-platforms-take-to- gamification-to-boost-user- engagement/articleshow/110161578.cm s 13
16. Center for Financial Inclusion. (2023). Maturing India Stack drives digital financial inclusion of gig workers. CGAP Blog. https://www.cgap.org/blog/maturing- india-stack-drives-digital-financial- inclusion-of-gig-workers 14
17. Financial struggles of India’s gig workers | World Business Watch | WION – YouTube, accessed on July 24, 2025, https://www.youtube.com/watch?v=V zPgs-W8LDw
18. The Rise and Challenges of the Gig Economy in India – Gigin.ai, accessed on July 24, 2025, https://gigin.ai/blog/jobs/gig- economy-in-india/
19. THE GAMIFICATION: APPLICATIONS AND DEVELOPMENTS FOR CREATIVITY AND EDUCATION – iris.unina.it, accessed on July 24, 2025, https://www.iris.unina.it/retrieve/a8e9 2777-7e5b-42d6-9f36- 5fca28627b0a/The%20Gamification.%20 Giuseppe%20Galetta.pdf
20. Gamification in Financial Management: Making Money Matters Fun, accessed on July 24, 2025, https://www.smartico.ai/blog- post/gamification-in-financial- management
21. Gamification in Financial Services: Benefits & Examples | Miquido Blog, accessed on July 24, 2025, https://www.miquido.com/blog/gamif ication-in-financial-services/
22. Gamification in Mobile Banking Apps: Case Studies – Smartico, accessed on July 24, 2025, https://www.smartico.ai/blog- post/gamification-in-mobile-banking- apps
Retirement in Future Times
By Mohit Yadav, Deputy General Manager,
PFRDA.
Retirement, as a socio-economic concept, emerged within an industrial framework characterized by stable employment, predictable incomes and clearly defined life stages. Individuals were expected to work for several decades, accumulate savings and eventually withdraw from the labour force. This model shaped pension systems, social security frameworks and personal financial planning across much of the world.
However, the rapid advancement of Artificial Intelligence and robotics is fundamentally challenging these assumptions. As machines increasingly substitute both manual and cognitive labour, the traditional link between work and income is beginning to weaken. While some technologists, including Elon Musk, envision a future of abundance in which work becomes optional and the relevance of retirement may disappear. Instead, it will evolve into a more flexible and dynamic phase of life, shaped as much by institutional constraints as by technological progress.
Structural Shifts: Labour Markets and Demographic Change
Labour markets are undergoing a paradigm shift. Automation is no longer confined to routine industrial tasks, it now extends into domains such as data analysis, medical diagnostics and legal research. This is altering the very nature of employment. Traditional long -term employment relationships, often accompanied by employer- sponsored pensions and benefits are increasingly being replaced by gig work and flexible arrangements. While such models provide autonomy, they also weaken access to structured retirement provisions. More importantly, they contribute to a deeper structural shift: the gradual decoupling of income from stable, continuous employment.
Elon Musk has repeatedly argued that AI could surpass human capabilities across many domains, potentially leading to large-scale job displacement. If fewer individuals are required for economically productive work, the question becomes not only how people will find jobs but how income itself will be distributed.
At the same time, demographic pressures are intensifying. Aging populations and declining birth rates are increasing dependency ratios, placing strain on systems where current workers fund retirees through taxation or contributions. While automation may offset labour shortages, it also complicates these systems by reducing the number of traditional contributors.
The Post-Scarcity Hypothesis and Its Limits
One of the most compelling arguments for the declining relevance of retirement is the possibility of a post-scarcity economy. In such a scenario, technological advancements reduce the marginal cost of producing goods and services to near zero, making them widely accessible.
Elon Musk envisages a future where automation could eliminate the need to work for basic survival. Within this vision, mechanisms such as Universal Basic Income (UBI) would provide individuals with a guaranteed income, ensuring economic stability regardless of employment status.
If realized, such a system would fundamentally transform the purpose of work. Employment would become a matter of choice rather than necessity, driven by creativity, interest or social contribution. In this context, retirement as a distinct phase of life defined by withdrawal from economic activity could lose its relevance.
However, this vision rests on several strong assumptions. Technological feasibility does not automatically translate into political or institutional feasibility. Implementing UBI at scale requires sustained political consensus, fiscal capacity and administrative efficiency that are unevenly distributed across countries.
Moreover, automation may concentrate wealth among those who own and control technological systems. Without effective redistributive policies, technological progress could aggravate inequality rather than alleviate it, underestimating the structural forces that historically shape wealth distribution.
Finally, scarcity itself may not disappear entirely. While technology can reduce the cost of many goods, resources such as land, natural assets and political access remain inherently limited. This suggests that economic insecurity may persist, even in highly automated societies.
The Transitional Challenge
Even if a future of abundance is achievable, the path toward it is likely to be uneven and disruptive. The benefits of automation will not be distributed uniformly across populations or generations. Younger individuals may adapt more easily to technological change, while older workers may face displacement with limited opportunities for retraining. This creates the risk of intergenerational inequality, where some groups benefit disproportionately while others experience prolonged insecurity.
Policy responses such as taxation of automation, expanded social protection or income redistribution are politically complicated. While figures like Elon Musk emphasize the necessity of such measures, their implementation remains uncertain.
A particularly important risk lies in expectations. If individuals assume that future systems will provide for their needs and reduce their savings prematurely, they may face significant hardship during transitional periods. In this sense, the future may promise abundance, but the present still demands caution.
Rethinking Retirement: Toward a Hybrid Model
Rather than disappearing, retirement is more likely to evolve into a hybrid and flexible concept.
First, retirement may become gradual rather than abrupt. Individuals could reduce working hours over time, maintaining partial engagement in the labour force while transitioning into later life.
Second, life trajectories may become more cyclical. Instead of a single continuous career followed by retirement, individuals may move through multiple phases of work, education and rest. This would require significant adjustments in education systems and labour market institutions.
Third, income sources are likely to diversify. Future financial security may depend on a combination of wages, savings, investments and public transfers. This increases resilience but also places greater responsibility on individuals to manage complex financial portfolios.
Finally, lifelong learning will become essential. As technological change accelerates, the ability to continuously acquire new skills will determine not only employability but also the duration and quality of participation in economic life.
Importantly, even in a highly automated future, retirement may persist not because individuals must cease working entirely, but because societies require structured phases for redistribution, caregiving and intergenerational balance.
Conclusion: Evolution, Not Elimination
The future of retirement lies at the intersection of technological possibility and social reality. While, the vision articulated by Elon Musk of a world where automation creates abundance and work becomes optional is captivating, it challenges deeply rooted assumptions about labour and income.
Yet significant uncertainties remain. Inequality, demographic pressures, institutional inertia and political constraints all complicate the realization of such a future. While Artificial Intelligence and robotics will undoubtedly transform the economic landscape, they are unlikely to eliminate the need for financial security and structured life planning in the foreseeable future.
Thus, retirement is being redefined. Shifting from a fixed endpoint to a flexible, evolving phase within a longer and more dynamic life course. The central challenge for both policymakers and individuals is to navigate this transition with realism, embracing the opportunities created by technological progress while remaining attentive to its limits.
*****
Section 4
International Section
Tontines
Picture a retirement scheme where your neighbour’s death makes you richer. It sounds like the plot of a black comedy and, in fact, it has been one, more than once. But for roughly two centuries, this was a perfectly ordinary, government-sanctioned way to save for old age. It’s called a tontine and it is quietly making a comeback.
An Italian Banker’s Pitch to a Cardinal
The story begins in 1653, when Lorenzo de Tonti, a Neapolitan banker living in exile in France, pitched an unusual fundraising idea to Cardinal Mazarin, chief minister to the young King Louis XIV. France’s treasury had been drained by the Thirty Years’ War and by domestic uprisings and the crown needed cash without raising taxes.
Tonti’s proposal worked like this: a group of subscribers would each pay into a shared fund and the fund would pay out annual interest. But instead of each investor’s return staying fixed, the interest owed to a member who died would be redistributed among the survivors. The longer you lived, the bigger your payout right up until the last surviving member collected the lion’s share. It was, in effect, a group bet on longevity, dressed up as a government bond.
Interestingly, the French parliament initially rejected Tonti’s plan. It wasn’t adopted formally until 1689- five years after Tonti himself had died, reportedly in obscurity, having spent several years imprisoned in the Bastille, from which he was released in 1675, for reasons that remain unclear. He never saw his invention take off and he certainly never profited from the name it would carry into history.
From War Chests to Bridges and Hotels
Once the French crown adopted the idea, tontines spread rapidly across Europe. Dutch cities had actually beaten France to it: the city of Kampen issued the first true tontine in 1670 and by 1700 nearly 200 Dutch municipal tontines were in circulation. France went on to organise nine further national tontines at irregular intervals through 1759 and Britain adopted the model as well, running its own government tontines well into the following century.
Governments weren’t the only ones who found tontines useful. Because a tontine could raise a lump sum upfront in exchange for a stream of future payments to survivors, it was a natural way to finance public infrastructure. London’s Richmond Bridge, completed in 1777, was built using two tontine schemes- investors bought £100 shares and were repaid out of the tolls collected from everyone crossing the bridge, with each survivor’s share growing as fellow investors died. The very last of the original subscribers died on 10 March 1859, at which point the tolls were discontinued and the bridge became free to cross, a piece of financial history that quite literally shaped the built environment.
Tontines financed several other landmarks in a similar fashion, including London’s Kew Bridge and the model proved so versatile that surplus tontine profits went on to fund the construction of hotels and public baths across Georgian Britain as well.
Why Tontines Fell Out of Favour
By the late 19th century, tontines had migrated from public finance into private life insurance, particularly in the United States, where “tontine insurance” policies became hugely popular. But popularity bred temptation. Insurance companies holding large tontine funds had every incentive to under-report survivors, delay payouts and quietly divert the accumulating pool for their own purposes, since policyholders had little visibility into how the fund was actually managed. The resulting scandals led New York State to convene the Armstrong Investigation in 1905 and by 1906 the state had effectively banned the sale of new tontine policies a prohibition that other states soon followed.
The reputational damage lingered for a century. The very premise of a tontine, that you benefit financially when a fellow member dies, has always made people faintly uneasy and popular culture leaned into it enthusiastically. Tontines have supplied the ominous plot device behind murder schemes in novels, films and even a 1996 episode of The Simpsons, “Raging Abe Simpson and His Grumbling Grandson in ‘The Curse of the Flying Hellfish’.
The Unexpected Comeback
And yet, the underlying mathematics of a tontine never stopped making sense, it just needed rehabilitating. The core problem tontines solve is one that has only grown more urgent i.e. longevity risk, the risk of outliving your own savings.
Traditional pensions used to absorb this risk for workers automatically, but as employers have shifted from defined-benefit pensions to defined- contribution accounts like 401(k)s, individuals are increasingly left to manage their own retirement drawdown, w ith no built-in protection against living, say, to 100. Commercial annuities can provide that protection, but they are expensive, complex and unpopular, a puzzle economists have long struggled to fully explain.
Enter the modern tontine. Financial researchers, notably Moshe Milevsky, have spent the last decade reworking Tonti’s 17th-century idea into something regulators might actually approve- transparent pools where “mortality credits” i.e. the money freed up when a member dies, are redistributed directly and traceably among survivors, without an insurance company sitting in the middle taking a cut and bearing the guarantee risk. Because there’s no guarantee to fund, modern tontines can, in theory, offer higher expected income than a comparable annuity.
Researchers have also fixed the design flaw that made classical tontines a poor fit for retirement spending- a simple tontine’s payouts start low and balloon dramatically in extreme old age, exactly the opposite of what most retirees say they want. Milevsky and Salisbury’s “natural” or level-payout tontine solves this by gradually lowering the base return over time so that the total payout to survivors stays roughly constant, rather than spiking.
Where Tontines Actually Operate Today
Despite the renewed academic interest, no country currently offers a classic, retail tontine the way an 18th-century Londoner could simply buy a share on the street. What exists in 2026 is scattered across a handful of jurisdictions and most of it sits closer to the pilot or policy- discussion stage than the mainstream product stage.
In the United States, tontines aren’t banned by name in most states, but any scheme that pools money from participants and promises future income runs straight into securities and insurance regulation and there is no established regulatory pathway for offering a retail tontine to ordinary savers.
The clearest regulatory foothold for an explicitly tontine-branded product currently sits in Sweden and Ireland.
Elsewhere, interest is real but still largely exploratory. Colombia’s government has been consulting with longevity researchers on building a modern tontine arrangement of its own and similar conversations are underway among policymakers and pension researchers in Canada and parts of continental Europe, without a live retail product yet on the market in any of them.
A 350-Year-Old Idea, Still Being Rewritten
What makes the tontine’s history so striking is how little the core mechanism has changed since 1653, even as everything around it has. The actuarial tables are now vastly more sophisticated, the regulatory scrutiny is far tighter and the design has been reworked to smooth out the payouts that once made tontines actuarially lopsided. But the essential wager, that a group can insure each other against the risk of living too long, simply by agreeing to redistribute what the departed leave behind, is exactly the one Lorenzo de Tonti made to a cardinal more than three and a half centuries ago.
References
Arapakis, K., & Wettstein, G. (2023). Longevity risk: An essay (Special Report). Center for Retirement Research at Boston College. https://crr.bc.edu/wp- content/uploads/2023/11/2023_Longevity- Risk.pdf
Bernhardt, T., & Donnelly, C. (2019). Modern tontine with bequest: Innovation in pooled annuity products. Insurance: Mathematics and Economics, 86, 168 –188. https://doi.org/10.1016/j.insmatheco.2019. 03.002
Britannica. (n.d.). Lorenzo de Tonti. Encyclopædia Britannica. Retrieved July 7, 2026, from https://www.britannica.com/biography/L orenzo-de-Tonti
Cookson, B. (2017, August 31). Richmond Bridge [Guest post]. London Historians’ Blog. https://londonhistorians.wordpress.com/2 017/08/31/richmond-bridge/
DeMatos, D. (2019, June 17). How insurance built London’s bridges. The Tontine Coffee- House. https://tontinecoffeehouse.com/2019/06/1 7/how-insurance-built-londons-bridges/
House of Commons Library. (2026, June). Pensions: Collective Defined Contribution (CDC) schemes (Research Briefing No. CBP- 8674). UK Parliament. https://commonslibrary.parliament.uk/res earch-briefings/cbp-8674/
Iwry, J. M., Haldeman, C., Gale, W. G., & John, D. C. (2020). Retirement tontines: A new way to finance retirement income [Policy brief]. Brookings Institution. https://www.brookings.edu/wp- content/uploads/2020/10/Retirement- Security-Project-Tontines-Policy-Brief-Oct- 2020.pdf
LegalClarity. (n.d.). What is a tontine? Definition, history and legality. Retrieved July 7, 2026, from https://legalclarity.org/what-is-a- tontine-and-how-does-it-work/
London Borough of Richmond upon Thames. (n.d.). Richmond Bridge: Local history note. Retrieved July 7, 2026, from https://www.richmond.gov.uk/richmond_ bridge_local_history_note
McKeever, K. (2009). A short history of tontines. Fordham Journal of Corporate & Financial Law, 15(2), 491 –521. https://scholarship.law.columbia.edu/cgi/ viewcontent.cgi?article=3214&context=facul ty_scholarship
McKeever, K. (2017, February 10). A tontine before Lorenzo de Tonti’s! The Lisbon tontine proposal of 1641. Fordham Journal of Corporate & Financial Law Blog. https://news.law.fordham.edu/jcfl/2017/0 2/10/a-tontine-before-lorenzo-de-tontis-the- lisbon-tontine-proposal-of-1641/
Ransom, R. L., & Sutch, R. (1987). Tontine insurance and the Armstrong investigation: A case of stifled innovation, 1868–1905. The Journal of Economic History, 47(2), 379–390. https://doi.org/10.1017/S0022050700048130
Stanford Center on Longevity. (2026, February 4). Retirement income gap sparks innovation. https://longevity.stanford.edu/retirement- income-gap-sparks-innovation/
Study.com. (n.d.). Tontine: History, definition & legality. Retrieved July 7, 2026, from https://study.com/academy/lesson/what- is-a-tontine-definition-legality.html
Tontine Trust. (n.d.). About Tontine Trust. Retrieved July 7, 2026, from https://tontine.com/about-us/
Section 5
Did You Know
Ponzi Schemes, Ageing and Fraud Risk to Retirees
Introduction
A Ponzi scheme is a fraud that pays earlier investors with money collected from later investors, creating an appearance of steady profit that has no real underlying source of return. The term comes from Charles Ponzi, whose 1920 Boston swindle became so notorious that his surname turned into the generic label for this entire category of investment deception. Because the scheme depends entirely on a continuous inflow of new money rather than genuine earnings, it is structurally unsustainable: once recruitment slows, the payment chain breaks and the scheme collapses. To understand why this fraud model remains so dangerous today, particularly for older and financially insecure people, it helps to examine exactly how Ponzi’s own scheme was built, sustained and finally unravelled.
A. The Birth of a Scheme: Charles Ponzi’s Boston Fraud
Charles Ponzi arrived in the United States in 1903 with little money and spent over a decade drifting between odd jobs, a brief spell running an import-export venture and two prison terms in Canada and the United States for forgery and for smuggling migrants. By 1919 he had settled in Boston and was struggling to make a living publishing a trade directory when a routine piece of correspondence changed his fortunes. A business contact in Spain sent him a reply using an International Reply Coupon (IRC), a voucher created by the Universal Postal Union in 1906 that allowed a sender in one country to prepay the return postage for a correspondent abroad.
Ponzi noticed that the coupon, bought cheaply in Spain, could be exchanged in the United States for postage worth several times as much. Back in 1919-1920, if you wanted to send someone in another country a letter and pay for their reply postage in advance, you could buy an “International Reply Coupon” in your country and mail it to them. They could then exchange that coupon for local postage stamps in their own country.
Here’s the key: the exchange rate between countries’ currencies had swung wildly after World War I (Italy’s currency, the lira, had crashed in value). But the price of postage coupons hadn’t been updated to match. The arbitrage, step by step:
1. Ponzi buys IRCs in Italy using cheap, devalued lira. Because the lira was worth so little compared to the US dollar, the coupons were dirt cheap when bought this way.
2. He ships those coupons to the US.
3. In the US, he exchanges the coupons for US postage stamps — at face value, as if the coupon were bought with strong US dollars.
4. He then sells those US stamps for cash.
Because he “bought low” (cheap lira – denominated coupons) and effectively “sold high” (redeemed them for dollar-value stamps), there was, in theory, a real profit margin, maybe 10% or so, if it actually worked at scale. That’s a legitimate arbitrage concept: exploit a price difference for the same thing in two different markets.
In January 1920, Ponzi incorporated the Securities Exchange Company and began soliciting investors, promising a 50% return within 45 days or a 100% return within 90 days, at a time when banks paid roughly 5% annually. His first month of business drew just 18 investors and $1,800. He repaid them promptly and in full the following month, using money raised from a newer, larger group of investors, which is the defining mechanic of the fraud that would later carry his name.
It is worth noting, as the historical record makes clear, that Ponzi did not invent this mechanism. Sarah Howe’s Ladies’ Deposit Company, which promised Boston women 8% monthly interest from around 1879 and William “520 Percent” Miller’s Franklin Syndicate, which promised New York investors 10% weekly returns from 1899, both operated on the identical principle of paying old depositors with new deposits and both eventually collapsed the same way. What made Ponzi’s name endure rather than theirs was less originality than scale and spectacle: his scheme moved far more money, over a much shorter period and collapsed far more publicly.
B. How the Fraud Perpetuated Itself
Ponzi’s scheme grew at extraordinary speed once early investors began receiving their promised returns. Word of mouth did most of the recruiting: satisfied early participants told friends, neighbours and colleagues and Ponzi’s own promotional flair did the rest. By July 1920, new money was arriving at a rate of close to one million dollars a day and Ponzi’s client base had grown to include Boston’s Italian immigrant community as well as bankers, clerks and reportedly a large share of the city’s police force. The money financed a lavish personal lifestyle: Ponzi bought a mansion in Lexington, Massachusetts, a luxury Locomobile automobile and maintained accounts across several New England banks. This visible success functioned as its own advertisement, reinforcing the impression of a legitimate, wildly profitable enterprise and encouraging still more people to invest and many existing investors to reinvest their “profits” rather than withdraw them. In reality, Ponzi never built the infrastructure to execute the underlying arbitrage at any meaningful scale. Financial journalist Clarence Barron, writing for the Boston Post, calculated that covering the volume of money Ponzi claimed to be moving would have required roughly 160 million postal reply coupons in circulation, when only about 27,000 actually existed worldwide. The entire operation was and always had been, a matter of using new deposits to pay off earlier obligations while the gap between what was owed and what actually existed grew wider by the day.
C. The Unravelling and Collapse Suspicion mounted through the summer of 1920 as journalists and financiers began asking how Ponzi’s returns could possibly be legitimate. Facing a Boston Post investigation, Ponzi tried to reassure the public by inviting a government audit of his books and voluntarily suspending new investments while it was conducted, a decision that, rather than calming fears, triggered a panic. Investors crowded his office demanding withdrawals and although Ponzi managed to pay out some of them, the run continued until the Massachusetts Bank Commissioner ordered a bank to stop honouring his checks in early August 1920.
The final blow came when the Boston Post revealed that Ponzi had two prior criminal convictions, for forgery in Canada and for smuggling migrants into the United States, information that destroyed what remained of his credibility. On 11 August 1920, with an audit confirming that his company held only a small fraction of the postal coupons needed to justify his claims, Ponzi surrendered to federal authorities. He was convicted of mail fraud and served three and a half years in prison, followed by further state charges and, later, another fraud conviction in Florida real estate; he was eventually deported to Italy and died in poverty in Rio de Janeiro in 1949.
The human cost was severe. Ponzi’s scheme is estimated to have cost investors around $20 million in 1920 dollars, equivalent to roughly $200 to $237 million today and its collapse contributed to the failure of half a dozen New England banks. Many victims had reinvested their early gains instead of withdrawing them and lost their entire savings when the structure gave way. The episode illustrates the core lesson that recurs in every Ponzi scheme since: the fraud can look and feel exactly like a legitimate, high- performing investment for as long as new money keeps arriving and it can devastate its participants the moment that inflow stops.
The Modern Echo: Bernie Madoff and Pension Fund Exposure
Ponzi’s Boston fraud lasted less than a year and moved tens of millions of dollars. Bernard Madoff’s fraud, uncovered in December 2008, ran for decades and consumed an estimated $65 billion in claimed value, including fictitious profits, making it the largest Ponzi scheme ever documented. Madoff was a former chairman of the NASDAQ stock exchange who used that credibility to build a wealth-management arm claiming steady annual returns of roughly 10% to 12% through a strategy he called “split-strike conversion”. The scheme is directly relevant to pension-sector readers because, unlike Ponzi’s retail solicitation of individual Bostonians, a large share of Madoff’s money arrived through institutional intermediaries entrusted with other people’s retirement savings.
The fraud’s mathematical impossibility was identified as early as 1999 by financial analyst Harry Markopolos, who found that Madoff’s reported returns rose in a near-perfect upward line with almost no losing months, a pattern no genuine trading strategy operating in real markets could produce. Markopolos submitted detailed evidence to the U.S. Securities and Exchange Commission in 2000, 2001 and again in a 2005 memorandum outlining roughly thirty distinct red flags, including the fact that Madoff’s claimed options volume exceeded the entire market’s reported volume and that his auditor was a two-person firm with no capacity to audit a fund of that size. On each occasion, the regulator closed its inquiry without taking action, in part because Madoff’s stature and registered broker-dealer business created a presumption of legitimacy that examiners did not look past.
The pension dimension is what distinguishes Madoff from Ponzi for the purposes of this article. Much of the money that reached Madoff passed through “feeder funds,” such as Fairfield Greenwich, Kingate and Tremont, that pooled capital from hedge funds, charities and companies that had set up retirement accounts for their own staff. Many of the underlying individuals never chose Madoff and, in numerous cases, were not even told that their retirement money had been routed to him; they had trusted a fund manager or employer – sponsored plan, which in turn had trusted Madoff. When the scheme collapsed, these second-level investors, including staff retirement plans, discovered that the layered structure that was supposed to diversify and professionalise their savings had instead concentrated their exposure to a single, undetected fraud.
The collapse itself followed the same arithmetic as Ponzi’s: it required a permanent, growing inflow of new money and it broke when that inflow reversed. The 2008 financial crisis triggered a wave of redemption requests that Madoff could not meet from any genuine trading activity and he confessed to his sons in December 2008, who reported him to federal authorities the same day. He was sentenced to 150 years in prison and court-appointed trustees have since spent more than a decade clawing back recoveries from feeder funds and early beneficiaries on behalf of the roughly 40,000 investors affected worldwide. For pension regulators and fund administrators, the enduring lesson is that neither scale, nor regulatory registration, nor a manager’s public reputation is proof of legitimacy: independent custody, verifiable audit trails and direct line-of- sight into where retirement money is actually invested are the safeguards that a plausible cover story cannot substitute for.
D. Age and Vulnerability
That history becomes more than a historical curiosity when it is connected to retirement-age vulnerability. Older adults are often seeking stable income, capital preservation and protection against inflation and medical shocks, which makes them especially attractive targets for schemes promising “safe,” “fixed,” or “guaranteed” returns. For a retiree, the pull of such an offer is often not greed but the practical need to stretch limited savings through uncertain years.
Ageing increases financial vulnerability in several distinct ways. Retirees have fewer working years left in which to recover from a loss and they typically rely on a fixed pool of savings, pensions, or family support, which makes them more sensitive to any disruption in cash flow. In these circumstances, even a moderate fraud loss can permanently alter living standards, healthcare access and household security
Indian elder-focused evidence reinforces this risk. HelpAge India reporting indicates that a large share of older Indians feel financially insecure and that many lack adequate independent income or social-security coverage. When an older person already feels economically exposed, an offer of regular, dependable income can look less like an obvious scam and more like a necessary lifeline, which is precisely why Ponzi schemes are so dangerous in the retirement context: they exploit need, not merely ignorance.
Psychologically, Ponzi schemes work because they generate early confidence. Small initial payouts, exactly as Ponzi engineered in January and February 1920, make the product appear legitimate, encouraging reinvestment and word- of-mouth referral. Retirees may be particularly susceptible to this dynamic because they often prefer predictability over volatility and give considerable weight to trust, reputation and personal recommendation. Once a scheme appears to “work,” scepticism tends to fall away too late.
E. Why the Link Matters
The connection between Ponzi schemes and ageing is not simply that older people can become victims. It is that ageing creates the conditions in which fraud becomes more persuasive and more damaging. A retiree with limited income, rising health costs and little time to rebuild lost wealth is exactly the kind of person who may be drawn to a promise of secure, steady returns. When that promise is false, the consequences can be catastrophic, because the loss is harder to absorb and far harder to replace than it would be for a younger investor with more years of earning ahead.
Madoff’s case shows that the same vulnerability operates one level up, at the level of the institutions ageing households rely on rather than the households themselves. A retiree does not need to be personally deceived by a fraudster to lose retirement savings; it is enough for the pension fund, provident scheme, or retirement plan into which they contribute to place uninformed trust in an intermediary that turns out to be fraudulent. This is why pension regulation typically cares as much about custody, audit independence and manager due diligence as it does about investor education: the ageing individual at the end of the chain has no way to see, let alone question, decisions made several layers upstream.
This is why the Ponzi story deserves to be told as more than a history of one famous scam. In India, it illustrates the intersection of retirement insecurity, elder vulnerability and a financial- fraud ecosystem that remains active at scale a century after Ponzi’s Boston office closed its doors and Madoff’s case extends the same lesson to the institutional side of the pension architecture that is meant to protect retirees in the first place. The underlying problem is not merely individual gullibility; it is a structural mismatch between the needs of ageing households and the tactics of modern fraud, whether that fraud targets a retiree directly or reaches them indirectly through the fund meant to safeguard their savings. That mismatch makes awareness, independent verification and age- sensitive regulation, at both the retail and institutional levels, essential components of financial protection.
F. India’s Fraud Landscape
The Reserve Bank of India’s fraud data shows that India continues to face significant financial fraud losses even as the pattern of fraud changes over time. In FY25, Indian banks reported 23,953 fraud cases worth ₹36,014 crore and the value of fraud rose sharply even as case counts fell (Business Standard, 2026; The Hindu, 2026). In FY26, the amount involved climbed further to ₹48,021 crore across 10,114 cases, with the RBI attributing much of this value to advances- related fraud (Economic Times BFSI, 2026; Hindu Business Line, 2026). The fraud problem in India is therefore not only widespread; it is becoming more concentrated in a smaller number of very high-value cases.
The RBI data also reveal an important retail trend: card, internet and digital-payment frauds declined sharply in FY26, both in number and value, suggesting that some payment-security measures are having an effect (Angel One, 2026; Business Standard, 2026). Yet the system overall still generated very large fraud losses, concentrated in lending and advances. This matters for an assessment of Ponzi-type risk because it shows that fraud in India is not confined to a single channel; it spans digital payments, lending, deposits and investment offerings alike.
There is also a direct ageing dimension in current RBI policy thinking. Reuters has reported that the RBI is considering additional safeguards for senior citizens in high-value digital transactions, including possible cooling-off delays and extra authentication steps, because older and otherwise vulnerable users are often prime targets for fraudsters (Reuters, 2026). This is a significant signal: the regulator itself is implicitly recognising age as a distinct risk factor in financial fraud exposure. Read alongside the evidence on elder financial insecurity, it strengthens the case for treating fraud prevention as part of ageing policy, not merely banking compliance.
References
Angel One. (2026, June). Bank fraud cases decrease but value rises to ₹48,000 crore in 2025 –26: RBI data. https://www.angelone.in/news/econo my/bank-fraud-cases-decrease-but- value-rises-to-48-000-crore-in-2025-26- rbi-data
Business Standard. (2026, May 29). Bank fraud cases halve but value climbs to ₹48,000 crore: RBI data. https://www.business- standard.com/industry/banking/bank- fraud-cases-halve-but-value-climbs-to- 48-000-crore-rbi-data- 126052900631_1.html
Charles Ponzi (1920). (n.d.). International Banker. https://internationalbanker.com/histor y-of-financial-crises/charles-ponzi- 1920/
CrimeReads. (2020, August 11). Fraud of the century: The Ponzi scheme, 100 years later. https://crimereads.com/fraud-of- the-century-the-ponzi-scheme-100-years- later/
EBSCO Research Starters. (n.d.). Ponzi cheats thousands in an investment scheme. EBSCO. https://www.ebsco.com/research- starters/politics-and- government/ponzi-cheats-thousands- investment-scheme
Economic Times BFSI. (2026, June). Surge in bank fraud: ₹48,021 crore in FY26 despite decrease in cases, RBI reports. https://bfsi.economictimes.indiatimes.com/articles/surge-in-bank-fraud-rs- 48021-crore-in-fy26-despite-decrease-in- cases-rbi-reports/131402703
Federal Bureau of Investigation. (n.d.). Bernie Madoff case. https://www.fbi.gov/history/cases- and-criminals/bernie-madoff
HelpAge India. (2025). The India intergenerational bonds (INBO) report 2025. https://www.helpageindia.org/wp- content/uploads/2025/06/The-India- Intergenerational-Bonds-INBO- HelpAge-India-Report-2025.pdf
Hindu Business Line. (2026, June). Financial institutions report over 10,000 cases of fraud involving ₹48,000 cr in FY26: RBI data. https://www.thehindubusinessline.com /money-and-banking/financial- institutions-report-over-10000-cases-of-fraud-involving-48000-cr-in-fy26-rbi- data/article71036570.ece
History Guild. (2025, November 17). “The best show that was ever staged”: Charles Ponzi’s scheme. https://historyguild.org/the-best-show- that-was-ever-staged-charles-ponzis- scheme/
History Hit. (2023, March 1). The rise and fall of Charles Ponzi: How a pyramid scheme changed the face of finance forever. https://www.historyhit.com/the-rise- and-fall-of-charles-ponzi-how-a- pyramid-scheme-changed-the-face-of- finance-forever/
National Archives. (2010). When Ponzi’s bubble burst. Prologue Magazine, 42(2). https://www.archives.gov/publications /prologue/2010/summer/ponzi- inmate-case-file
National Postal Museum. (n.d.). Ponzi scheme. Smithsonian Institution. https://postalmuseum.si.edu/exhibitio n/behind-the-badge-case-histories- scams-and-schemes/ponzi-scheme
New Indian Express. (2025, August 1). 70 per cent of India’s elderly financially dependent; mental health issues and social isolation on the rise: Report. https://www.newindianexpress.com/n ation/2025/Aug/01/70-per-cent-of- indias-elderly-financially-dependent- mental-health-issues-and-social- isolation-on-rise-report
Reuters. (2026, April 9). India’s central bank mulls delay on some digital payments to curb fraud. https://www.reuters.com/sustainabilit y/boards-policy-regulation/indias- central-bank-mulls-delay-some-digital- payments-curb-fraud-2026-04-09/
The Hindu. (2024, June). Elders are financially not secure: HelpAge India report. https://www.thehindu.com/news/nati onal/karnataka/elders-are-financially- not-secure-helpage-india- report/article68301108.ece
The Hindu. (2026, June). Size of bank frauds seen rising though cases are on a decline: RBI report. https://www.thehindu.com/business/s ize-of-bank-frauds-seen-rising-though- cases-on-a-decline-rbi- report/article70450129.ece
ThePrint. (2025). India’s elderly are losing savings to scams and health problems. https://theprint.in/feature/india- elderly-losing-savings-scams-health- problems/2651557/
Times of India. (2024, June). Study: 33% of seniors without income, 65% financially insecure. https://timesofindia.indiatimes.com/cit y/delhi/study-33-of-seniors-without- income-65-financially- insecure/articleshow/111008224.cms
U.S. Securities and Exchange Commission. (n.d.). Ponzi schemes. Investor.gov. https://www.investor.gov/introduction -investing/investing- basics/glossary/ponzi-schemes
Withorn, C. (2021, April 14). The investors who had to pay back billions in ill-gotten gains from Bernie Madoff’s Ponzi scheme. Forbes. https://www.forbes.com/sites/chasewi thorn/2021/04/14/the-investors-who- had-to-pay-back-billions-in-ill-gotten- gains-from-bernie-madoffs-ponzi- scheme/
Section 6
Circulars/Regulations/Guidelines
| Circular No: PFRDA/2026/22/SUP-CRA/03 | |
| 07th April 2026 | NPS Swasthya Pension Scheme- Proof of Concept (PoC 2) under the Regulatory Sandbox Framework |
PFRDA has introduced Proof of Concept (PoC 2) under the Regulatory Sandbox Framework for the NPS Swasthya Pension Scheme, incorporating stakeholder feedback and operational experience from the initial PoC. The revised framework aims to enhance subscriber flexibility while evaluating the scheme under a wider range of scenarios.
Key Highlights:
- Mandatory health insurance under IRDAI regulations.
- Minimum initial contribution: ₹25,000.
- 100% corpus withdrawal permitted for eligible inpatient medical emergencies.
- Direct settlement of medical claims through authorised healthcare administrators.
- PoC 2 to be launched by Pension Funds with prior PFRDA approval.
- registration journey via the chosen e-Sign or mobile OTP method.
| Circular No: PFRDA/2026/23/REG-CRA/01 | |
| 29th April 2026 | Clarification on Charge Structure of CRAs under the pension schemes regulated /administered by the PFRDA |
PFRDA has issued a clarification on the charge structure applicable to Central Recordkeeping Agencies (CRAs) under pension schemes regulated/administered by the Authority. The circular provides greater clarity on the levy of Annual Maintenance Charges (AMC), PRAN opening charges and the treatment of dormant and zero-balance accounts.
Key Highlights:
- Tier II AMC aligned with Tier I; no AMC for Tier II accounts with corpus up to ₹1,000.
- Dormant accounts to attract only 10% of the applicable AMC.
- No PRAN opening charge for activation/opening of additional Tier I or Tier II accounts under an existing PRAN.
- Nil AMC for zero-balance accounts under APY and NPS-Lite.
| Circular No: PFRDA/2026/24/REG-PF/05 | |
| 05th May 2026 | Applicability of SEBI Regulations relating to Insider Trading, Self- Dealing and Front Running to NPS investments – Supersession of PFRDA Circular dated 25 July 2019 |
PFRDA has clarified that SEBI regulations relating to insider trading, self-dealing and front running shall apply to all NPS investment activities. The circular supersedes the earlier PFRDA circular dated 25 July 2019, ensuring a uniform regulatory framework and avoiding duplication of regulatory provisions.
Key Highlights:
- SEBI regulations on insider trading, self-dealing and front running made applicable to NPS investments.
- 2019 PFRDA circular on the subject superseded with immediate effect.
- Pension Funds to adopt SEBI-compliant internal policies, codes of conduct and compliance frameworks.
- PFRDA to oversee governance and compliance through its supervisory framework.
| Circular No: PFRDA/2026/25/NPS-AGRI/01 | |
| 06th May 2026 | Introduction of ‘NPS Sanchay’ (simplified NPS Variant) under All Citizen Model and MSF Framework for Informal Sector |
The PFRDA circular dated January 12, 2026, outlines the framework for sharing subscriber data with Pension Funds (PFs) under the Multiple Scheme Framework (MSF).
- Objective: To empower PFs to design and distribute schemes under their own brand, improving NPS outreach and subscriber engagement.
- Data Sharing: Central Recordkeeping Agencies (CRAs) will provide 15 specific demographic data points to PFs for targeted communication and relationship management.
- Key Data Points: Shared information includes names, contact details, date of birth, occupation, income range and marital status.
- Usage Restrictions: PFs are strictly prohibited from sharing this data with third parties or using it for non-NPS purposes.
- Privacy Compliance: All data handling must strictly adhere to the Digital Personal Data Protection Act, 2023.
- Engagement Goals: The data supports life-stage messaging, such as retirement planning and milestone alerts.
| Circular No: PFRDA/2026/26/REG-POP/05 | |
| 12th May 2026 | Clarification on engagement of Pension Agents under the PFRDA (Point of Presence) Regulations 2018 and amendments thereof |
PFRDA has issued a clarification on the engagement of Pension Agents under the amended PFRDA (Point of Presence) Regulations, 2018. The circular aims to strengthen identification, monitoring and governance of Pension Agents engaged by multiple Points of Presence (PoPs).
Key Highlights:
- PAN to serve as the unique identifier for Pension Agents across all PoPs.
- CRAs to maintain PAN-based records of Pension Agents.
- PoPs to publish a half-yearly list of engaged Pension Agents on their websites.
- Nodal Officers to be designated by PoPs for Pension Agent engagement and queries.
- with hospitals/HBAs, adhering to the Digital Personal Data Protection Act, 2023.
| Circular No: PFRDA/2026/27/NPS-AGRI/02 | |
| 12th May 2026 | Extension of incentive framework to grass-root Pension Agents for enrollments facilitated under NPS Sanchay |
PFRDA has introduced NPS Sanchay, a simplified variant of the National Pension System (NPS) under the All Citizen Model and Multi Scheme Framework (MSF) to expand pension coverage among India’s informal workforce. The scheme simplifies investment choices and facilitates easier onboarding while promoting long-term retirement savings for underserved segments.
Key Highlights:
- NPS Sanchay launched as a simplified NPS variant for the informal sector.
- Open to Indian citizens aged 18–85 years.
- Simplified investment framework with default asset allocation.
- Available through all registered Pension Funds under the MSF framework.
- Existing NPS provisions on withdrawals, charges and fund switching continue to apply.
| Circular No: PFRDA/2026/29/REG-PF/06 | |
| 13th May 2026 | Inclusion of Rupee Bonds issued by New Development Bank in the eligible investment universe under NPS |
PFRDA has amended the NPS Investment Guidelines to include Rupee-denominated Bonds issued by the New Development Bank (NDB) as eligible investment instruments for both Government and Non-Government sector schemes. The amendment follows the in-principle approval of the Department of Economic Affairs, Ministry of Finance.
Key Highlights:
- NDB Rupee Bonds included in the eligible investment universe under NPS.
- Applicable to Government and Non-Government sector investment guidelines.
- Existing credit rating (AA or above) and maturity requirements remain unchanged.
- Circular effective immediately.
| Circular No: PFRDA/2026/30/SUP-ASP/01 | |
| 14th May 2026 | Clarification on permissibility and procedure for surrender of annuity policies in certain cases |
PFRDA has issued a clarification permitting the surrender of annuity policies in specified exceptional cases, while continuing to safeguard the objective of providing long-term retirement income security. The circular also prescribes a transparent process to be followed by Annuity Service Providers (ASPs).
Key Highlights:
- Surrender permitted in cases of critical illness of the annuitant or eligible family members.
- Applicable to annuity policies issued before 24 October 2024 with an explicit surrender clause.
- ASPs to ensure transparent disclosure of surrender value, charges and taxes before processing requests.
- Surrender requests to be processed only after written consent of the annuitant and reported to the concerned CRA and PFRDA.
| Circular No: PFRDA/2026/31/MWnR/01 | |
| 15th May 2026 | Introduction of Retirement Income Schemes (RIS) and Drawdown options under the National Pension System (NPS) |
PFRDA has introduced Retirement Income Schemes (RIS) and Drawdown Options under the National Pension System (NPS) to enhance flexibility during the decumulation phase. The framework allows eligible subscribers to receive systematic payouts while the balance corpus remains invested, thereby supporting regular retirement income and long-term wealth management.
Key Highlights:
- Introduces flexible Retirement Income Schemes (RIS) for post-retirement income.
- Offers SPR and SUR as drawdown options.
- Allows periodic withdrawals while the remaining corpus stays invested.
- Existing annuity requirements under NPS continue to apply.
| Circular No: PFRDA/2026/14/NPS-Vatsalya/02 | |
| 02nd June 2026 | Framework for Regulatory Sandbox for Facilitating Responsible Innovation in the Pension Sector |
PFRDA has introduced a Regulatory Sandbox Framework to facilitate responsible innovation in the pension sector. The framework provides a controlled environment for testing innovative products, services, business models and technology-driven solutions while ensuring subscriber protection and regulatory oversight.
Key Highlights:
- Establishes a Regulatory Sandbox for controlled testing of innovative pension solutions.
- Open to PFRDA-regulated entities, FinTech firms and other eligible applicants.
- Emphasises subscriber protection, data privacy and cybersecurity during testing.
- Enables time-bound testing under regulatory oversight with limited relaxations, where applicable.
| Circular No: PFRDA/2026/32/REG-POP/06 | |
| 3rd June 2026 | Introduction of StAR NPS platform developed by BSE Technologies Pvt Ltd (BTPL) for onboarding of subscribers under NPS reg |
PFRDA has introduced the StAR NPS platform, developed by BSE Technologies Pvt. Ltd. (BTPL), to enable a seamless digital onboarding experience for subscribers under the National Pension System (NPS). The platform aims to simplify subscriber registration through Points of Presence (PoPs) while enhancing efficiency and digital accessibility.
Key Highlights:
- StAR NPS introduced for assisted digital onboarding of NPS subscribers.
- Enables end-to-end digital registration with CKYC/DigiLocker-based verification.
- Subscriber contributions routed directly to the Trustee Bank, eliminating fund pooling by PoPs.
- Supports seamless integration with CRAs, Trustee Bank and other NPS ecosystem entities.
| Circular No: PFRDA/2026/38/SUP-POP/07 | |
| 16th June 2026 | Compliance towards Government Entity Criteria and applicability of Flat charge structure for availing PoP services by such entity(s) |
PFRDA has introduced a revised audit framework for Points of Presence (PoPs) undertaking NPS-Lite activities to strengthen governance, operational efficiency and regulatory compliance. The framework prescribes a comprehensive audit scope, reporting format and timelines for periodic external audits.
Key Highlights:
- External audit of PoPs-NPS Lite mandated once every three years.
- Prescribes eligibility criteria, audit scope and a standardised audit reporting format.
- Covers compliance with KYC/AML, internal controls, cybersecurity, grievance redressal and operational processes.
- Timely submission of audit reports mandated, with PFRDA oversight for compliance.
- claims.
| Circular No: PFRDA/2026/35/P&DCORP/01 | |
| 16th June 2026 | Audit of Points of Presence performing activities of NPS-Lite (PoPs-NPS-Lite) |
PFRDA has introduced a revised audit framework for Points of Presence (PoPs) undertaking NPS-Lite activities to strengthen governance, operational efficiency and regulatory compliance. The framework prescribes a comprehensive audit scope, reporting format and timelines for periodic external audits
Key Highlights:
- External audit of PoPs-NPS Lite mandated once every three years.
- Prescribes eligibility criteria, audit scope and a standardised audit reporting format.
- Covers compliance with KYC/AML, internal controls, cybersecurity, grievance redressal and operational processes.
- Timely submission of audit reports mandated, with PFRDA oversight for compliance.
| Circular No: PFRDA/2026/36/SUP-POP/05 | |
| 17th June 2026 | Audit of Points of Presence (PoPs) performing activities of National Pension System (NPS) including NPS Vatsalya (PoPs – NPS) |
PFRDA has introduced a revised audit framework for Points of Presence (PoPs) undertaking National Pension System (NPS) activities, including NPS Vatsalya, to strengthen governance, operational efficiency and regulatory compliance. The framework prescribes audit frequency based on subscriber base, along with a standardised audit scope, reporting format and timelines.
Key Highlights:
- Introduces a risk-based audit frequency linked to the subscriber base of PoPs.
- Prescribes eligibility criteria, audit scope and a standardised audit reporting format.
- Covers KYC/AML compliance, subscriber servicing, cybersecurity, grievance redressal and operational controls.
- Mandates timely submission of audit reports, with PFRDA oversight to ensure compliance.
| Circular No: PFRDA/2026/37/SUP-POP/06 | |
| 17th June 2026 | Audit of Points of Presence performing activities of Atal Pension Yojana (PoPs-APY) |
PFRDA has introduced a revised audit framework for Points of Presence (PoPs) undertaking Atal Pension Yojana (APY) activities to strengthen governance, operational efficiency and regulatory compliance. The framework prescribes audit frequency based on subscriber base, along with a standardised audit scope, reporting format and timelines..
Key Highlights:
- Introduces a risk-based audit frequency linked to the APY subscriber base of PoPs.
- Prescribes eligibility criteria, audit scope and a standardised audit reporting format.
- Covers KYC/AML compliance, contribution processing, grievance redressal, cybersecurity and Government co-contribution management.
- Mandates timely submission of audit reports, with PFRDA oversight to ensure compliance.
Section 7
NPS/APY Statistics
Sector Wise Growth
Table 1: NPS & APY growth in Subscribers base as on 31st May 2026
| S.N. | Sector | No. of Subscribers (in lakh)/ | YoY (%) | Share (%) | ||
|---|---|---|---|---|---|---|
| 31-May-25 | 31-Mar-26 | 31-May-26 | ||||
| i | CG | 27,48,846 | 28,28,776 | 28,48,127 | 3.6 | 2.9 |
| ii | SG | 72,32,619 | 76,21,638 | 76,83,765 | 6.2 | 7.8 |
| Sub Total | 99,81,465 | 1,04,50,414 | 1,05,31,892 | 5.5 | 10.7 | |
| iii | Corporate | 23,81,227 | 27,56,368 | 28,99,777 | 21.8 | 2.9 |
| iv | All Citizen | 43,04,984 | 50,16,387 | 51,22,463 | 19.0 | 5.2 |
| v | Vatsalya | 1,14,583 | 2,15,124 | 2,57,962 | 125.1 | 0.3 |
| Sub Total | 68,00,794 | 79,87,879 | 82,80,202 | 21.8 | 8.4 | |
| vi | NPS Lite | 33,50,478 | 33,49,169 | 33,48,080 | -0.1 | 3.4 |
| vii | APY | 6,53,03,153 | 7,45,84,915 | 7,61,72,223 | 16.6 | 77.5 |
| viii | Grand Total |
8,54,35,890 | 9,63,72,377 | 9,83,32,397 | 15.1 | 100.0 |
Source: CRAs
Table 2: NPS & APY growth in Contribution as on 31st May 2026
| S.N. | Sector | Contribution (Rs. in crore) | YoY (%) | Share (%) | ||
|---|---|---|---|---|---|---|
| 31-May-25 | 31-Mar-26 | 31-May-26 | ||||
| (i) | CG | 2,68,898.50 | 3,09,129.87 | 3,17,287.91 | 18.0 | 24.5 |
| (ii) | SG | 5,21,462.20 | 6,10,423.61 | 6,27,678.00 | 20.4 | 48.4 |
| Sub Total | 7,90,360.69 | 9,19,553.47 | 9,44,965.91 | 19.6 | 72.9 | |
| (iii) | Corporate | 1,58,031.43 | 1,99,398.28 | 2,07,466.93 | 31.3 | 16.0 |
| (iv) | All Citizen | 68,149.54 | 76,773.45 | 78,507.67 | 15.2 | 6.1 |
| (v) | Vatsalya | 124.56 | 281.39 | 325.98 | 15.8 | 0.0 |
| (vi) | Tier-II | 10,467.86 | 12,349.37 | 12,723.95 | 21.6 | 1.0 |
| (vii) | TTS | 19.55 | 20.35 | 20.53 | 5.0 | 0.0 |
| (viii) | MSF Tier-I | – | 353.11 | 571.97 | – | 0.0 |
| Sub Total | 2,36,792.94 | 2,89,175.96 | 2,99,617.04 | 26.5 | 23.1 | |
| (ix) | NPS Lite | 3,584.55 | 3,740.35 | 3,771.67 | 5.2 | 0.3 |
| (x) | APY* | 39,906.63 | 46,709.80 | 48,282.60 | 21.0 | 3.7 |
| Grand Total | 10,70,644.81 | 12,59,179.58 | 12,96,637.22 | 21.1 | 100.0 | |
* Fig does not include APY Fund Scheme; Source: CRAs
Table 3: NPS & APY growth in AUM as 31st May 2026
| S.N. | Sector | AUM (Rs. in crore) | YoY (%) | Share (%) | ||
|---|---|---|---|---|---|---|
| 31-May-25 | 31-Mar-26 | 31-May-26 | ||||
| (i) | CG | 4,03,370.08 | 4,28,619.73 | 4,46,725.40 | 10.75 | 25.92 |
| (ii) | SG | 7,55,021.98 | 8,16,929.88 | 8,52,051.51 | 12.85 | 49.45 |
| Sub Total | 11,58,392.06 | 12,45,549.62 | 12,98,776.91 | 12.12 | 75.37 | |
| (iii) | Corporate | 2,33,192.48 | 2,64,672.92 | 2,81,712.24 | 20.81 | 16.35 |
| (iv) | All Citizen | 68,419.31 | 70,507.84 | 73,257.73 | 7.07 | 4.25 |
| (v) | Vatsalya | 654.73 | 267.04 | 322.88 | -50.69 | 0.02 |
| (vi) | MSF | – | 323.99 | 560.29 | #DIV/0! | 0.03 |
| (vii) | Tier-II | 7,344.70 | 7,759.86 | 8,172.69 | 11.27 | 0.47 |
| (viii) | TTS | 20.27 | 18.06 | 18.17 | -10.34 | 0.00 |
| Sub Total | 3,09,631.50 | 3,43,549.70 | 3,64,043.99 | 17.57 | 21.13 | |
| (ix) | NPS Lite | 6,295.43 | 6,159.24 | 6,307.65 | 0.19 | 0.37 |
| (x) | APY* | 47,261.46 | 51,586.88 | 54,052.92 | 14.37 | 3.14 |
| Grand Total |
15,21,580.45 | 16,46,845.45 | 17,23,181.47 | 13.25 | 100.00 | |
* Fig does not include APY Fund Scheme; MSF is included in respective Sector; Source: CRAs.
II. PFM-wise Total Assets under NPS schemes
Table 4: Pension Fund-wise Assets under Management (in crore) as on 29th May 2026
| PF | AUM (Rs. In Crore) | Growth (%) | % share | |||
|---|---|---|---|---|---|---|
| 31-May-25 | 31-Mar-25 | 29-May-26 | YOY | Over March25 |
||
| SBI | 5,38,705 | 5,14,752 | 5,86,132 | 8.80% | 13.87% | 33.98914912 |
| LIC | 4,01,143 | 3,82,441 | 4,38,990 | 9.43% | 14.79% | 25.4565466 |
| UTI | 3,78,736 | 3,59,180 | 4,17,087 | 10.13% | 16.12% | 24.18641575 |
| ICICI | 48,466 | 45,455 | 1,67,428 | 245.45% | 268.34% | 9.708965316 |
| Kotak | 6,921 | 6,378 | 65,822 | 851.05% | 932.02% | 3.816945284 |
| HDFC | 1,26,316 | 1,15,627 | 17,380 | -86.24% | -84.97% | 1.007847058 |
| Birla | 4,485 | 4,025 | 9,546 | 112.84% | 137.17% | 0.553562026 |
| Tata | 4,423 | 4,385 | 7,592 | 71.65% | 73.14% | 0.440251718 |
Source: Trace Portal
III. PFM-wise Return on NPS Schemes
Table 5: Returns since inception (in %) as on 31st May 2026
Pension Funds→ |
SBI |
LIC |
UTI |
ICICI |
KOTAK |
HDFC |
AdityaBirla |
TATA |
Axis |
DSP |
|
CG |
9.33% |
9.19% |
9.17% |
– |
– |
– |
– |
– |
– |
– |
|
SG |
8.88% |
8.96% |
8.94% |
– |
– |
– |
– |
– |
– |
– |
|
Corporate-CG |
8.98% |
9.07% |
– |
– |
– |
– |
– |
– |
– |
– |
|
TIER I |
E |
10.68% |
12.22% |
12.21% |
12.48% |
11.85% |
13.94% |
12.26% |
13.11% |
10.38% |
8.83% |
C |
9.39% |
8.71% |
8.61% |
9.35% |
9.10% |
9.05% |
8.21% |
7.41% |
7.85% |
8.11% |
|
G |
8.79% |
9.22% |
8.08% |
8.25% |
8.18% |
8.54% |
7.69% |
7.21% |
7.42% |
7.55% |
|
TIER II |
E |
10.61% |
10.65% |
11.17% |
11.34% |
11.41% |
12.69% |
12.40% |
12.93% |
11.28% |
7.24% |
C |
8.98% |
8.28% |
8.59% |
9.18% |
8.49% |
8.46% |
7.76% |
7.52% |
7.37% |
8.71% |
|
G |
8.84% |
9.39% |
8.55% |
8.30% |
7.97% |
8.70% |
7.24% |
7.42% |
7.13% |
7.81% |
|
TTS |
6.39% |
7.52% |
6.70% |
7.40% |
7.55% |
6.88% |
7.55% |
7.58% |
5.15% |
6.18% |
|
NPS Lite POP |
9.40% |
9.35% |
9.34% |
– |
8.40% |
– |
– |
– |
– |
– |
|
APY |
8.49% |
8.75% |
8.75% |
– |
– |
– |
– |
– |
– |
– |
|
Tier II Composite |
|||||||||||
Source: Trace Portal