Budget at a Glance presents broad aggregates of the Budget in a reader-friendly document. This document shows receipts and expenditure as well as the Fiscal Deficit (FD), Revenue Deficit (RD), Effective Revenue Deficit (ERD), and the Primary Deficit (PD). of the Government of India. Besides, it presents a pictorial account of sources of receipts, their application, the details of debt and deficit indicators, sources of deficit financing and trends and composition of important budgetary variables through charts and graphs.
2. Fiscal Deficit is the difference between the Revenue Receipts plus Non-debt Capital Receipts (NDCR) and the total expenditure. FD is reflective of the total borrowing requirements of Government. Revenue Deficit refers to the excess of revenue expenditure over revenue receipts. Effective Revenue Deficit is the difference between Revenue Deficit and Grants for Creation of Capital Assets. Primary Deficit is measured as Fiscal Deficit less interest payments.
3. Budget 2018-19 reflects the Government’s firm commitment to substantially boost investment in Agriculture, Social Sector, Digital Payments, Infrastructure and Employment Generation on the one hand and simultaneously stick to the path of fiscal rectitude by aiming for a reduction of FD by 0.2% of GDP over RE 2017-18. This is substantiated by increase in expenditure of Rs. 2,24,463 crores over RE (2017-18) while simultaneously keeping the fiscal deficit at 3.3% of GDP.
4. In RE 2017-18, the total expenditure has been kept at Rs. 22,17,750 crore and is more than BE 2017-18 by Rs. 71,015 crore. The increase in total expenditure is mainly due to the outgo on account of GST Compensation to States, increased outlays on some important schemes and also to meet the recommendation of 7th CPC with respect to allowances and pensions.
5. The devolution of States’ share in taxes witnessed a major jump after the implementation of XIV Finance Commission from 2015-2016 onwards. Continuing with this trend, the total resources going to States including the devolution of State’s share in taxes, Grants/Loans, and releases under Centrally Sponsored Schemes in BE (2018-19) is 212,69,435 crore, with a jump of 21,53,558 crore over RE (2017-18) and 2 2,83,760 crore more than the Actuals (2016-17).
Budget at a Glance

1. Excluding receipts under Market Stabilization Scheme
2. Includes draw down of Cash Balance
Notes:
(i) GDP for BE 2018-2019 has been projected at Rs. 18722302 crore assuming 11.5% growth over the estimated GDP of Rs. 16784679 crore for 2017-18 (RE).
(ii) Individual items in this document may not sum up to the totals due to rounding off
(iii) Figures in parenthesis are as a percentage of GDP
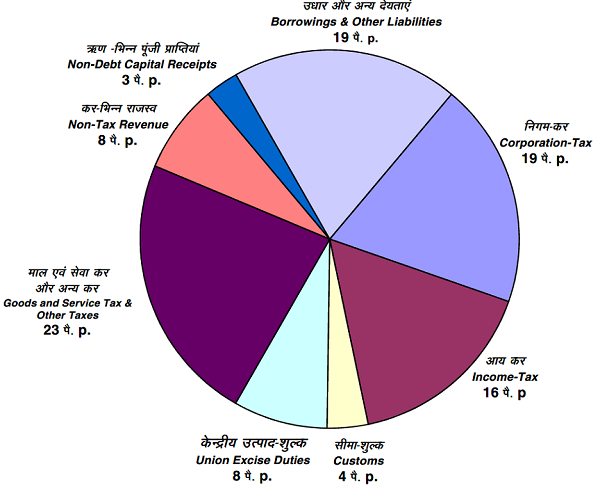
Rupee Comes From
Budget 2018-2019)

Notes:-
1. Total receipts are inclusive of States’ share of taxes and duties which have been netted in the table on page 1.
2. represents Service tax and other taxes in BE 2017-18.
Rupee Goes To
Budget 2018-2019)


Note:- Total expenditure is inclusive of the States’ share of taxes and duties which have been netted against receipts in the table on page 1.